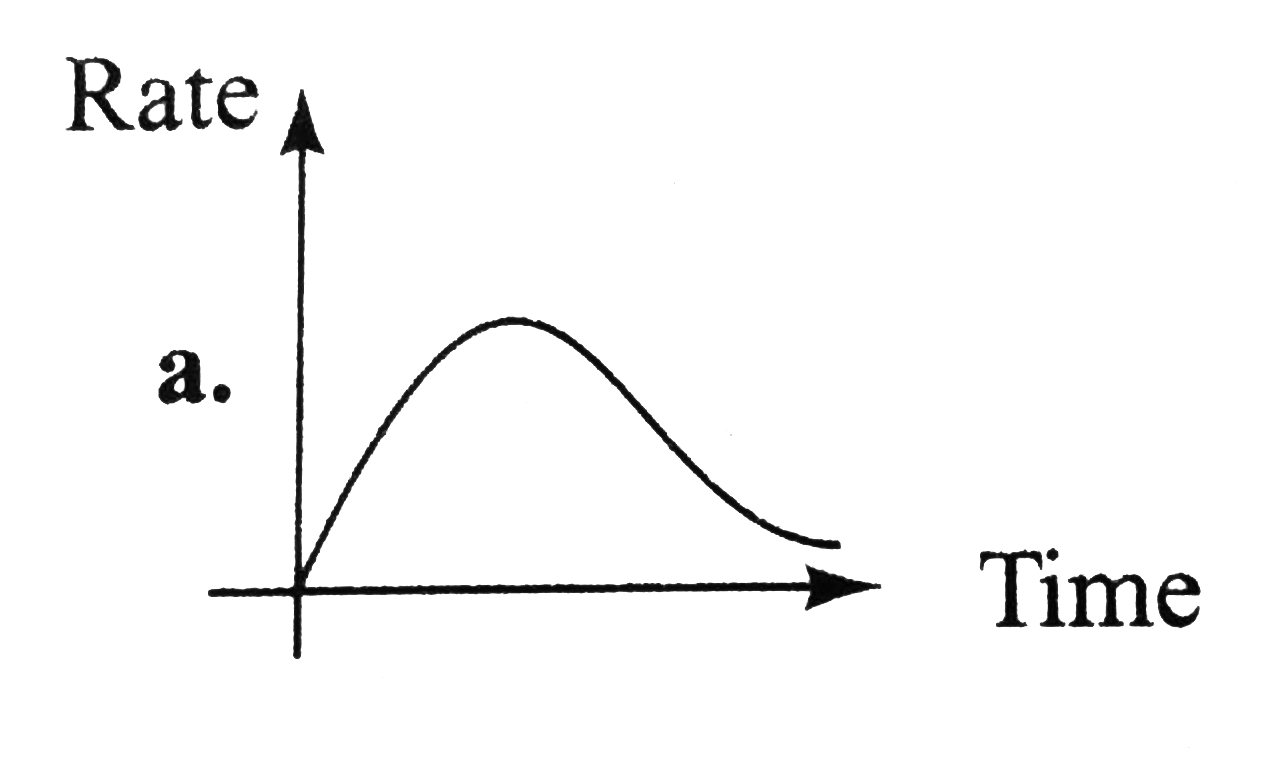
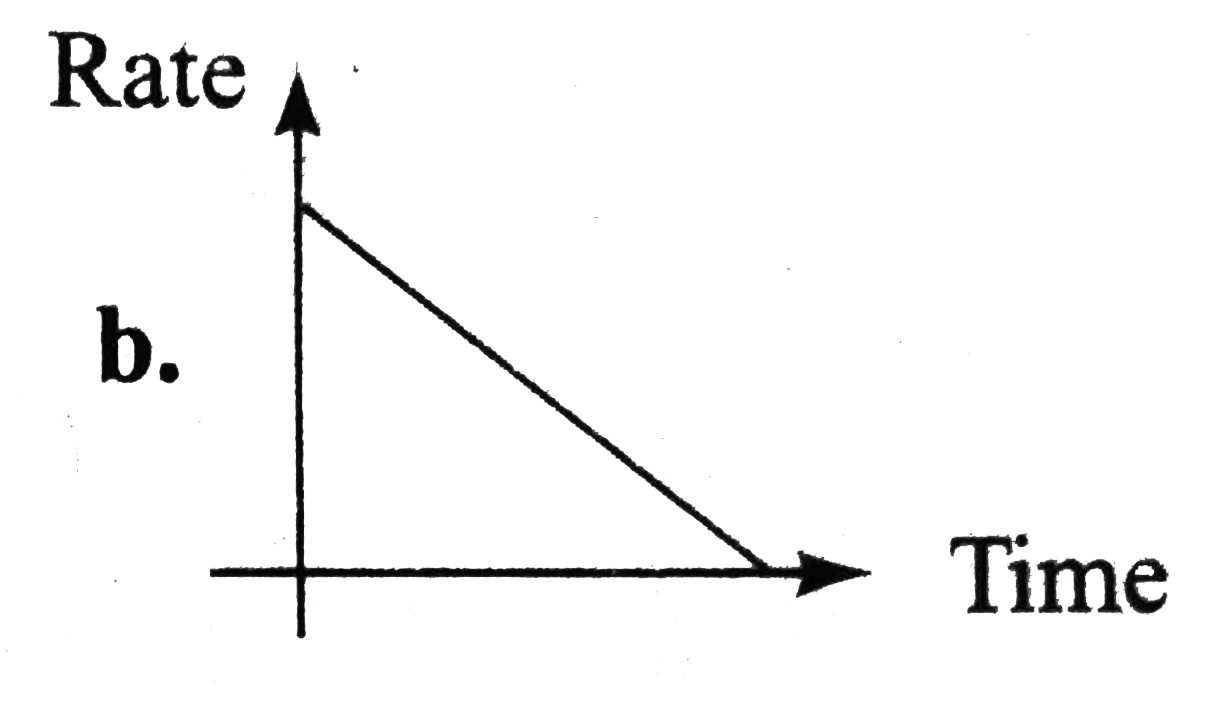
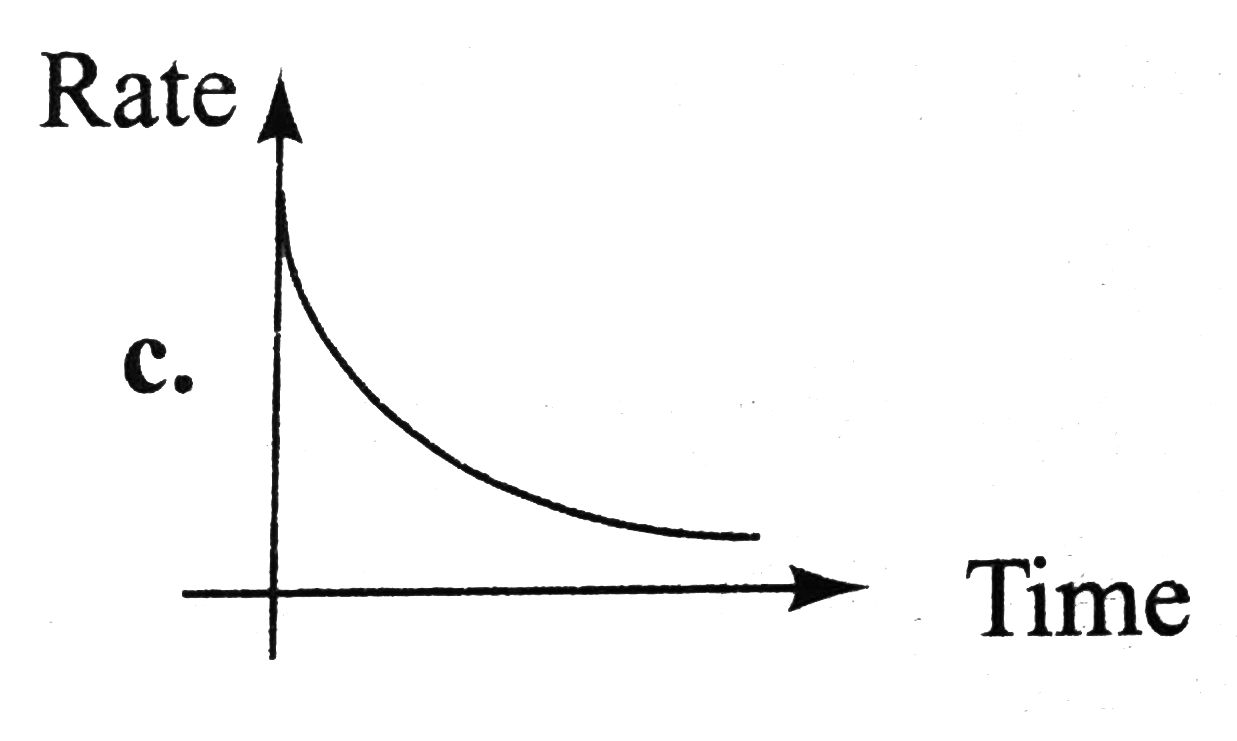
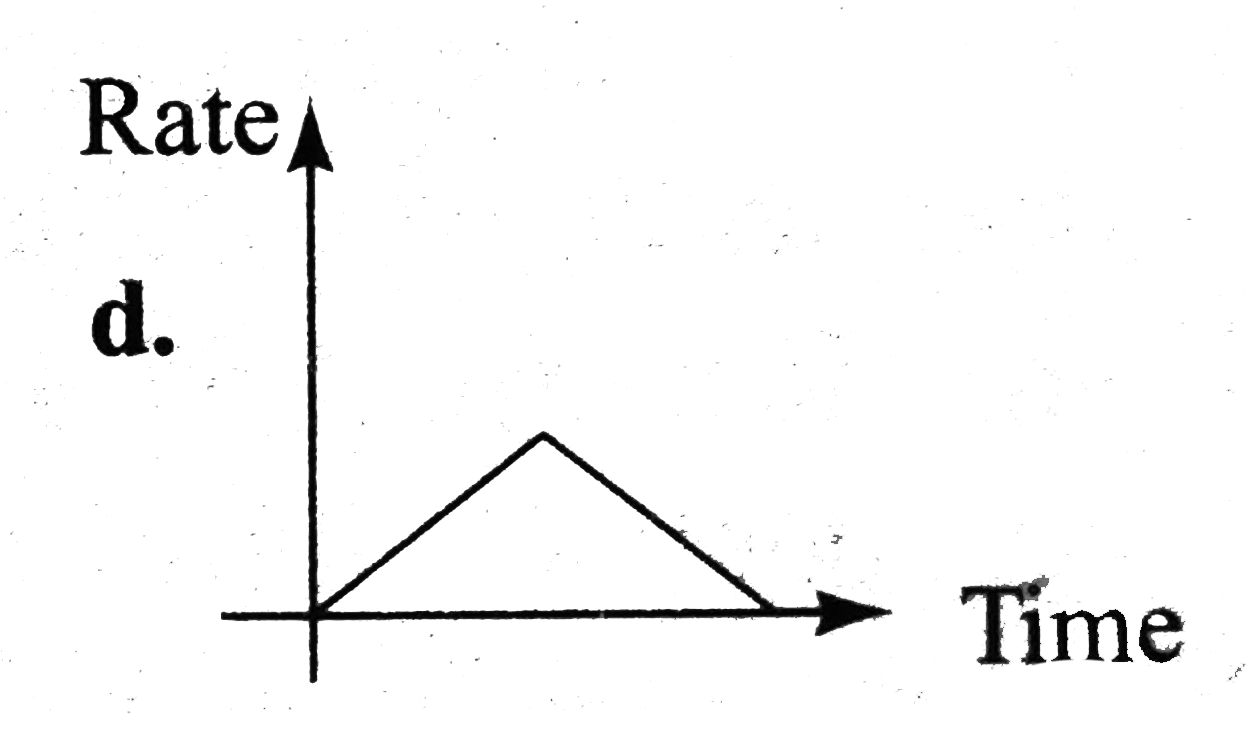
Home
Class 12
PHYSICS
In an LR circuit connected to a battery,...

In an `LR` circuit connected to a battery, the rate at which energy is stored in the inductor is plotted against time during the growth of current in the circuit. Which of the following best represents the resulation curve?

A

B

C

D

Text Solution

AI Generated Solution

The correct Answer is:
To solve the problem, we need to analyze the behavior of energy stored in an inductor in an LR circuit over time as the current grows. Here’s a step-by-step breakdown of the solution: ### Step 1: Understand the Energy Stored in the Inductor The energy (U) stored in an inductor is given by the formula: \[ U = \frac{1}{2} L I^2 \] where \( L \) is the inductance and \( I \) is the current flowing through the inductor. ### Step 2: Determine the Rate of Change of Energy To find the rate at which energy is stored in the inductor, we need to differentiate the energy with respect to time (t): \[ \frac{dU}{dt} = \frac{d}{dt} \left( \frac{1}{2} L I^2 \right) \] Using the chain rule, we get: \[ \frac{dU}{dt} = L I \frac{dI}{dt} \] This expression indicates that the rate of change of energy depends on both the current (I) and the rate of change of current (\( \frac{dI}{dt} \)). ### Step 3: Analyze the Behavior at Initial and Final Times - At \( t = 0 \): The current \( I \) is zero, hence: \[ \frac{dU}{dt} = L \cdot 0 \cdot \frac{dI}{dt} = 0 \] - At \( t = \infty \): The current reaches its maximum value \( I_0 \), and the rate of change of current \( \frac{dI}{dt} \) approaches zero as the circuit reaches steady state. Thus: \[ \frac{dU}{dt} = L I_0 \cdot 0 = 0 \] ### Step 4: Sketch the Graph From the analysis, we can conclude: - The rate of energy storage starts at zero when \( t = 0 \). - It increases as the current increases and reaches a maximum value at some point during the growth of current. - Finally, as the current stabilizes, the rate of energy storage returns to zero when \( t \) approaches infinity. ### Step 5: Identify the Correct Graph Based on the above behavior, the graph that best represents the rate of energy storage against time will start at zero, rise to a maximum, and then return to zero as time approaches infinity. The correct option is **Graph A**, which shows this behavior.

To solve the problem, we need to analyze the behavior of energy stored in an inductor in an LR circuit over time as the current grows. Here’s a step-by-step breakdown of the solution: ### Step 1: Understand the Energy Stored in the Inductor The energy (U) stored in an inductor is given by the formula: \[ U = \frac{1}{2} L I^2 \] where \( L \) is the inductance and \( I \) is the current flowing through the inductor. ### Step 2: Determine the Rate of Change of Energy ...
Promotional Banner

Topper's Solved these Questions

  • INDUCTANCE

    CENGAGE PHYSICS|Exercise Exercises (multiple Correct )|7 Videos
  • INDUCTANCE

    CENGAGE PHYSICS|Exercise Exercises (assertion-reasoning)|2 Videos
  • INDUCTANCE

    CENGAGE PHYSICS|Exercise Exercises (subjective)|7 Videos
  • HEATING EFFECT OF CURRENT

    CENGAGE PHYSICS|Exercise Thermal Power in Resistance Connected in Circuit|28 Videos
  • KINETIC THEORY

    CENGAGE PHYSICS|Exercise Question Bank|31 Videos

Similar Questions

Explore conceptually related problems

A simple LR circuit is connected to a battery at time t = 0 . The energy stored in the inductor reaches half its maximum value at time

The rate of decay (R ) of nuclei in a radioactive sample is plotted against time (t) . Which of the following best represents the resulting curve ?

The rate of decay (R ) of nuclei in a radioactive sample is plotted against time (t). Which of the following best represents the resulting curve ?

During current growth in L-R circuit, match the following table,

An ideal cell is connected to a capacitor through a voltmeter. The reading V of the voltmeter is plotted agains time. Which of the following best represents the resulting curve?

In an L-R circuit connected to a battery of constant emf E, switched is closed at time t=0. If denotes the induced emf across inductor and I the current in the circuit at any time t. Then which of the following graphs shown the variation of e with i?

If maximum energy is stored in capacitor at t = 0 then find the time after which current in the circuit will be maximum.

When an electric heater is switched on, the current flowing through it ( i ) is plotted against time ( t ). Taking into account the variation of resistance with temperature, which of the following best represents the resulting curve

In a decaying L-R circuit, the time after which energy stores in the inductor reduces to one fourth of its initial values is

An inductor and a capacitor are joined in series to an AC source. The frequency of the AC is gradually increased. The phase difference varphi between the emf and the current is plotted against nthe angular frequency omega . Which of the following best represents the resulting curve?

CENGAGE PHYSICS-INDUCTANCE-Exercises (single Correct )
  1. In the circuit shows Fig the coil has inductance and resistance. When ...

    Text Solution

    |

  2. A long solenoid having 200 turns per centimeter carries a current of 1...

    Text Solution

    |

  3. In an LR circuit connected to a battery, the rate at which energy is s...

    Text Solution

    |

  4. Two coils are at fixed location: When coil 1 has no current and the cu...

    Text Solution

    |

  5. Two concentric and coplanar coils have redii a and b ( gt gt a) as s...

    Text Solution

    |

  6. A current i(0) is flowing through an L-R circuit of time constant i(0)...

    Text Solution

    |

  7. In the circuit shown in figure switch S is closed at time t=0. The cha...

    Text Solution

    |

  8. A bar magnet was pulled away from a hollow coil A as shows in Fig As t...

    Text Solution

    |

  9. In the given circuit (Fig), key K is witched on the at t = 0. The rati...

    Text Solution

    |

  10. A closed loop of cross-sectional area 10^(-2) m^(2) which has inductan...

    Text Solution

    |

  11. In Fig. key K is closed at t = 0. After a long time, the potential dif...

    Text Solution

    |

  12. A solenoid of inductance L with resistance r is connected in parallel ...

    Text Solution

    |

  13. The cell in the circuit shows in Fig is ideal. The coil has an inducta...

    Text Solution

    |

  14. Switch S shown in Fig. is closed for t lt 0 and is opened at t = 0. Wh...

    Text Solution

    |

  15. In Fig, the mutual inductance of a coil and a very long straight wire ...

    Text Solution

    |

  16. In the circuit shows in Fig switch S is shifed to position 2 from posi...

    Text Solution

    |

  17. The capacitance in an oscilatory LC circuit is increased by 1%. The ch...

    Text Solution

    |

  18. In the circuit of Fig. (1) and (2) are ammeters. Just after circuit K ...

    Text Solution

    |

  19. A wire of fixed length is wound on a solenoid of lengthl and redius r....

    Text Solution

    |

  20. The frequency of oscillation of current in the inductance is

    Text Solution

    |