A
B
C
D
Text Solution
Verified by Experts
The correct Answer is:


Topper's Solved these Questions
Similar Questions
Explore conceptually related problems
CENGAGE PHYSICS-ARCHIVES 1 VOLUME 6-Multi Correct
- For an ideal gas :
Text Solution
|
- An ideal gas is taken from the state A (pressure P, volume V) to the s...
Text Solution
|
- Two bodies A and B have thermal emissivities of 0.01 and 0.81 respecti...
Text Solution
|
- From the following statements concerning ideal gas at any given temper...
Text Solution
|
- During the melting of a slab of ice at 273K at atmospheric pressure,
Text Solution
|
- Let barv,v(rms) and vp respectively denote the mean speed. Root mean s...
Text Solution
|
- A bimetallic strip is formed out of two identical strips one of copper...
Text Solution
|
- A black body of temperature T is inside chamber of T0 temperature init...
Text Solution
|
- Cv and Cp denote the molar specific heat capacities of a gas at consta...
Text Solution
|
- The figure shows the P-V plot of an ideal gas taken through a cycle AB...
Text Solution
|
- One mole of an ideal gas in initial state A undergoes a cyclic process...
Text Solution
|
- A composite block is made of slabs A,B,C,D and E of different thermal ...
Text Solution
|
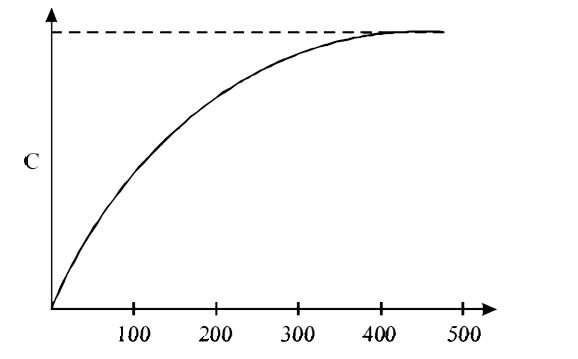
- The figure below shows the variation of specific heat capacity (C) of ...
Text Solution
|