 .
.Text Solution
Verified by Experts


Topper's Solved these Questions
GENERAL PRINCIPLES AND PROCESS OF ISOLATION OF ELEMENTS
CENGAGE CHEMISTRY|Exercise Solved Example|25 VideosGENERAL PRINCIPLES AND PROCESS OF ISOLATION OF ELEMENTS
CENGAGE CHEMISTRY|Exercise Exs 1.1 (Subjective)|25 VideosELECTROCHEMISTRY
CENGAGE CHEMISTRY|Exercise Archieves Subjective|35 VideosGRIGNARD REAGENTS AND ORGANOMETALLIC REAGENTS
CENGAGE CHEMISTRY|Exercise Exercises Archives (Linked Comprehension)|1 Videos
Similar Questions
Explore conceptually related problems
CENGAGE CHEMISTRY-GENERAL PRINCIPLES AND PROCESS OF ISOLATION OF ELEMENTS-Archives (Subjective)
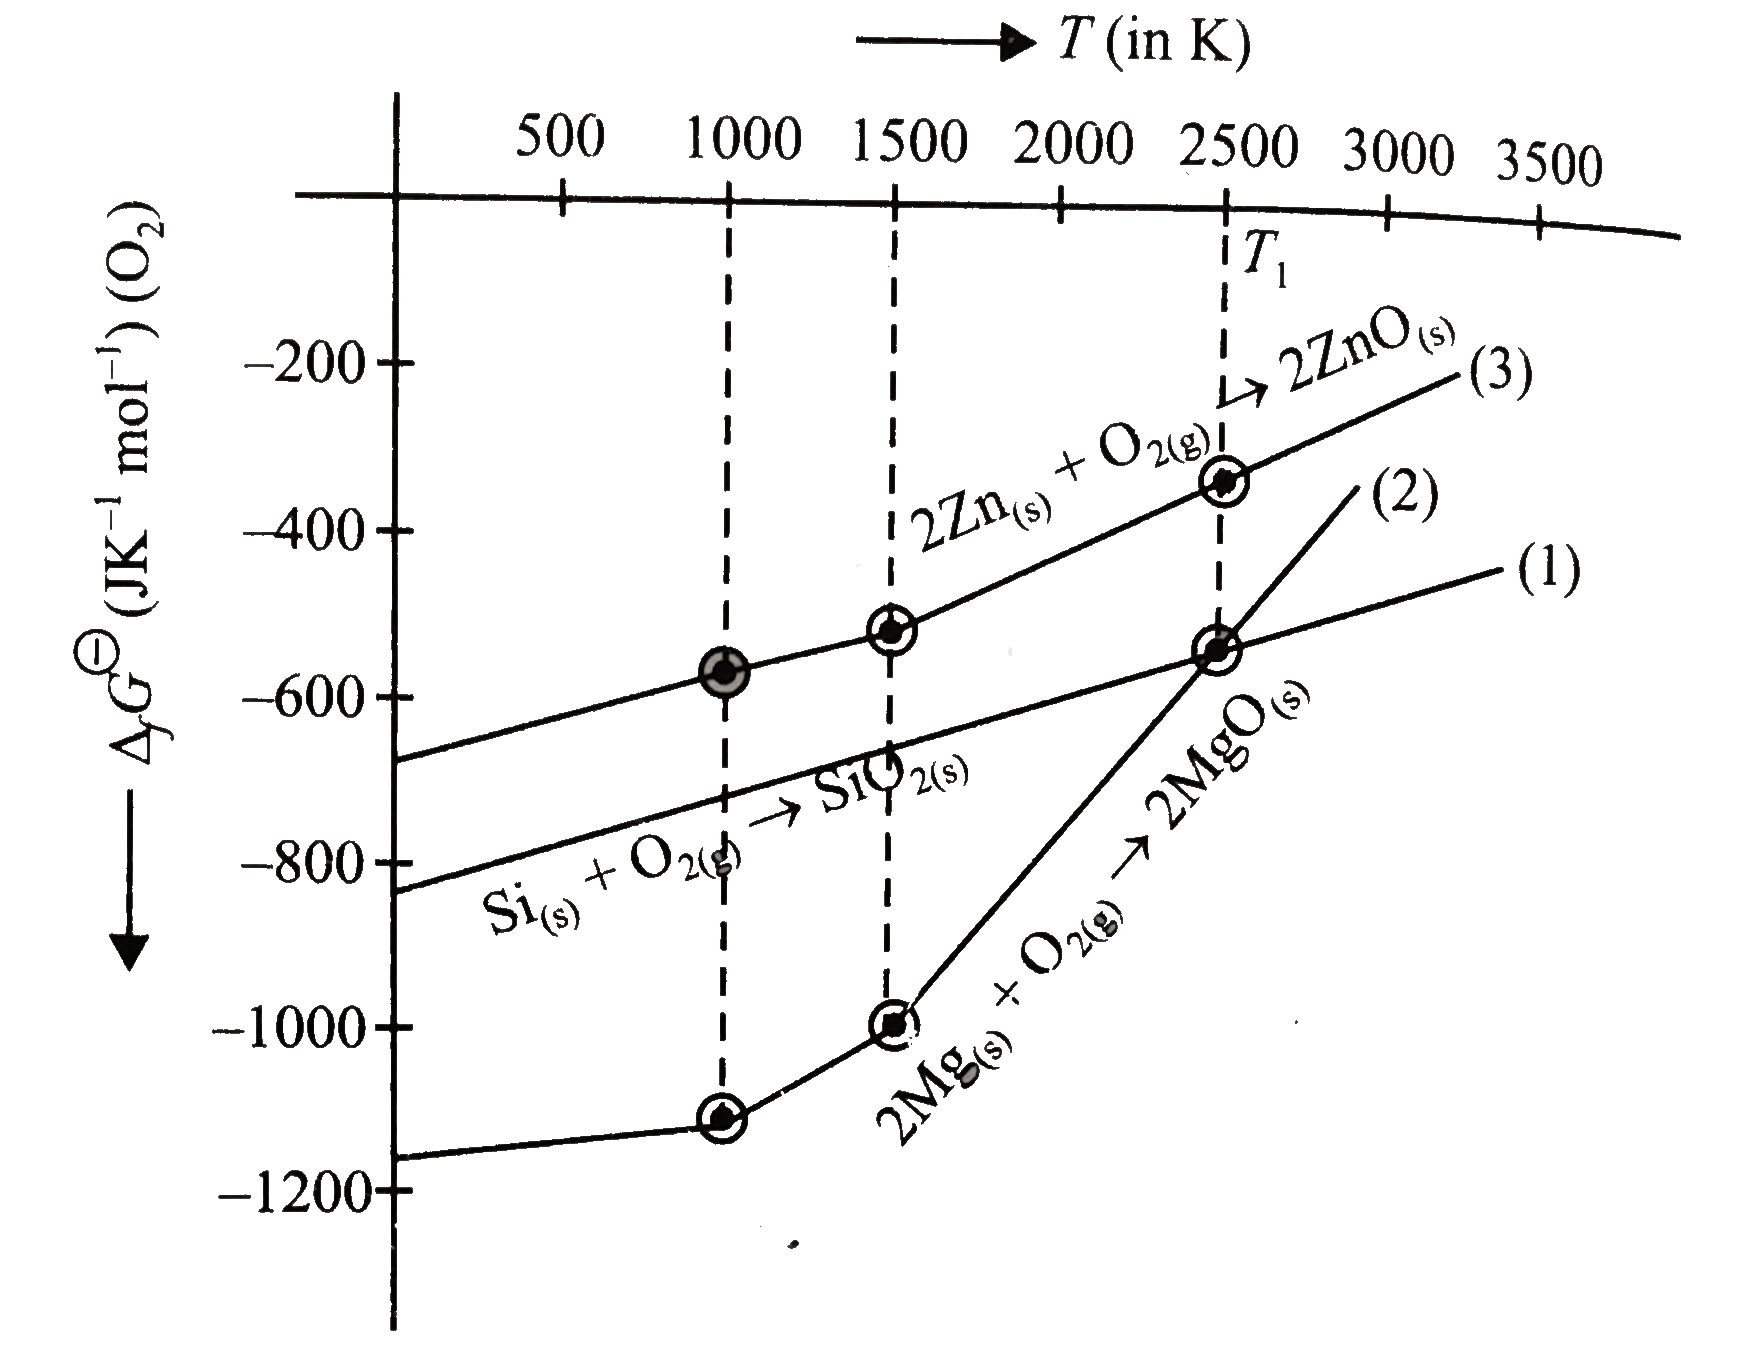
- Interpret the following Ellingham diagram. .
Text Solution
|
- Write the chemical equations involved in the extraction of lead from g...
Text Solution
|
- State the conditions under which the preparation of alumina from alumi...
Text Solution
|
- Each of the following statements is true only under some specific cond...
Text Solution
|
- Write the balanced equations for the reaction occuring when gold is di...
Text Solution
|
- Answer the following questions briefly. (i) What is the actual reduc...
Text Solution
|
- Give balanced equations for the following. "Extraction of silver fro...
Text Solution
|
- Write balanced equations for "the extraction of copper from pyrites by...
Text Solution
|
- Give briefly the isolation of magnesium from sea water. Give equation...
Text Solution
|
- Give reasons for the following. "Although aluminium is above hydrogen ...
Text Solution
|
- When the ore haematite is burnt in air with coke around 2000 K along w...
Text Solution
|
- Write the chemical reactions involved in the extraction of metallic si...
Text Solution
|
- How is boron obtained from borax ? Give the chemical reactions involve...
Text Solution
|
- Write down the reactions involved in the extraction of Pb. What is the...
Text Solution
|
- A(1) and A(2) are two ores of metal M.A(1) on calcination gives a blac...
Text Solution
|