Home
Class 11
PHYSICS
Among the four graphs shown in the figur...

Among the four graphs shown in the figure there is only one graph for which average velocity over the time interval (0,T) can vanish for a suitably chosen `T`. Which one is it ?

A

.

B

.

C

.

D

.

Text Solution

Verified by Experts

The correct Answer is:
B

In graph (b) for one value of displacement there are two different points of time. Hence, for one time, the average velocity is positive and for other time is equivalent negative.
As there are opposite velocities in the interval `0` to `T` hence average velocity can vanish in (b). This can be seen in the figure given below
Here, `OA = BT` (same displacement) for two different points of time.
Promotional Banner

Topper's Solved these Questions

  • GENERAL KINEMATICS AND MOTION IN ONE DIMENSION

    A2Z|Exercise Problem Based On Mixed Concepts|30 Videos
  • GENERAL KINEMATICS AND MOTION IN ONE DIMENSION

    A2Z|Exercise Assertion Reasoning|20 Videos
  • GENERAL KINEMATICS AND MOTION IN ONE DIMENSION

    A2Z|Exercise Relative Motion In One Dimension|20 Videos
  • FLUID MECHANICS

    A2Z|Exercise Chapter Test|29 Videos
  • GRAVITATION

    A2Z|Exercise Chapter Test|29 Videos

Similar Questions

Explore conceptually related problems

A particle obeys the following v - t graph as shown. The average velocity over 30 s is

s-t graph of a particle in motion is shown in Fig. Calculate Average velocity

An object starts at the origin in a straight line. Its velocity versus time graph is shown in the figure. Which one of the following choices best gives the proper intervals (s) of time for which the object is moving away from the origin?

For which of the following graphs the average velocity of a particl moving along a straight line for time interval (0,t) must be negative -

The velocity-time graph of a body is shown in figure. The ratio of magnitude of average acceleration during the intervals OA and AB is

The vecs-t graph of a body is a shown in the figure The time for which the body is in motion is________ second

Position - time graph for a particle is shown in figure. Starting from t = 0, at what time t, the average velocity is zer?

A material particle is moving along a straight line in such a manner that its velocity varies as shown in the figure. At which moment in time numbered successively on the time axis will the acceleration of the particle be maximal? How should one use the graph to determine the average velocity of motion over the time interval from t_1 to t_2 ?

The acceleration time graph of a body moving in a straight is shown in figure. Assertion :- Velocity of the body is continously increasing over the time interval shown. Reason :- Acceleration is positive for all shown value of t .

A2Z-GENERAL KINEMATICS AND MOTION IN ONE DIMENSION-Understanding Motion Through Graphs
  1. From the following displacement-time graph find out the velocity of a ...

    Text Solution

    |

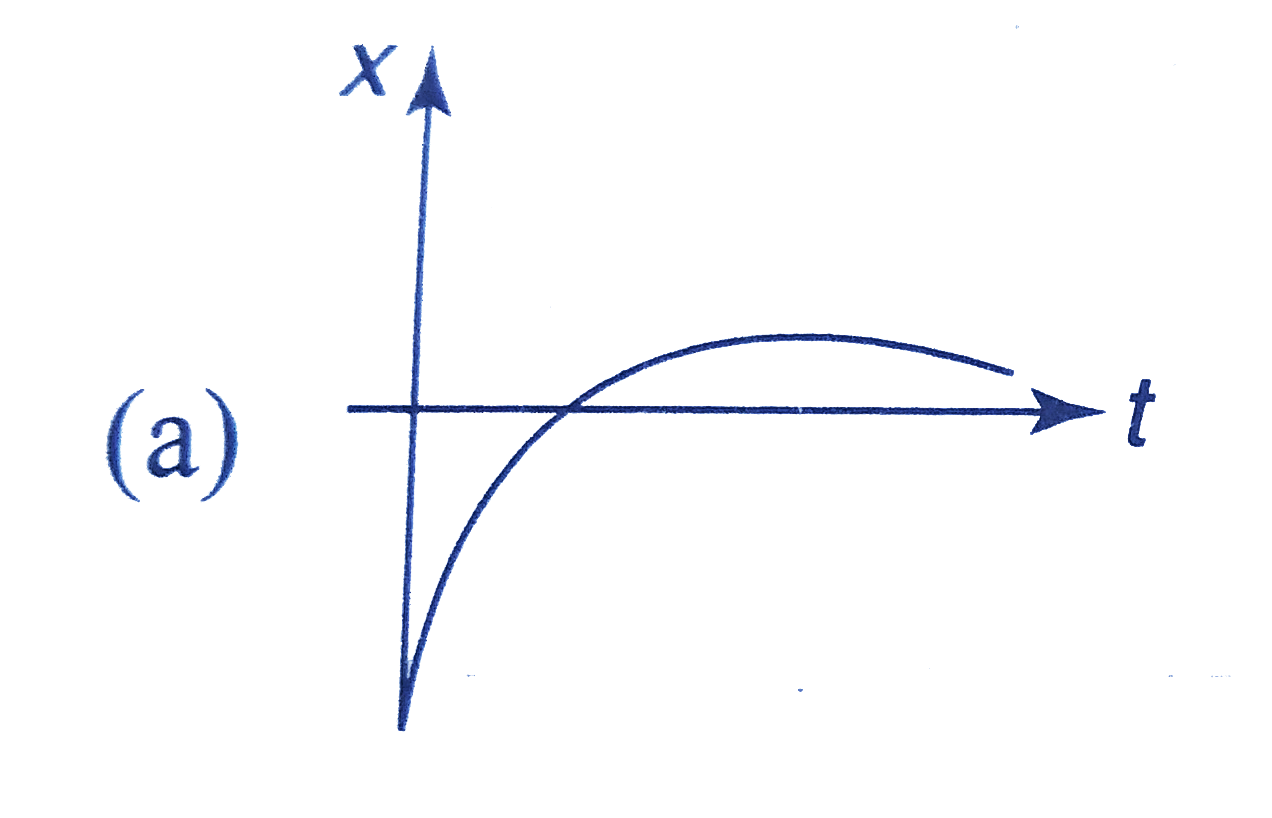
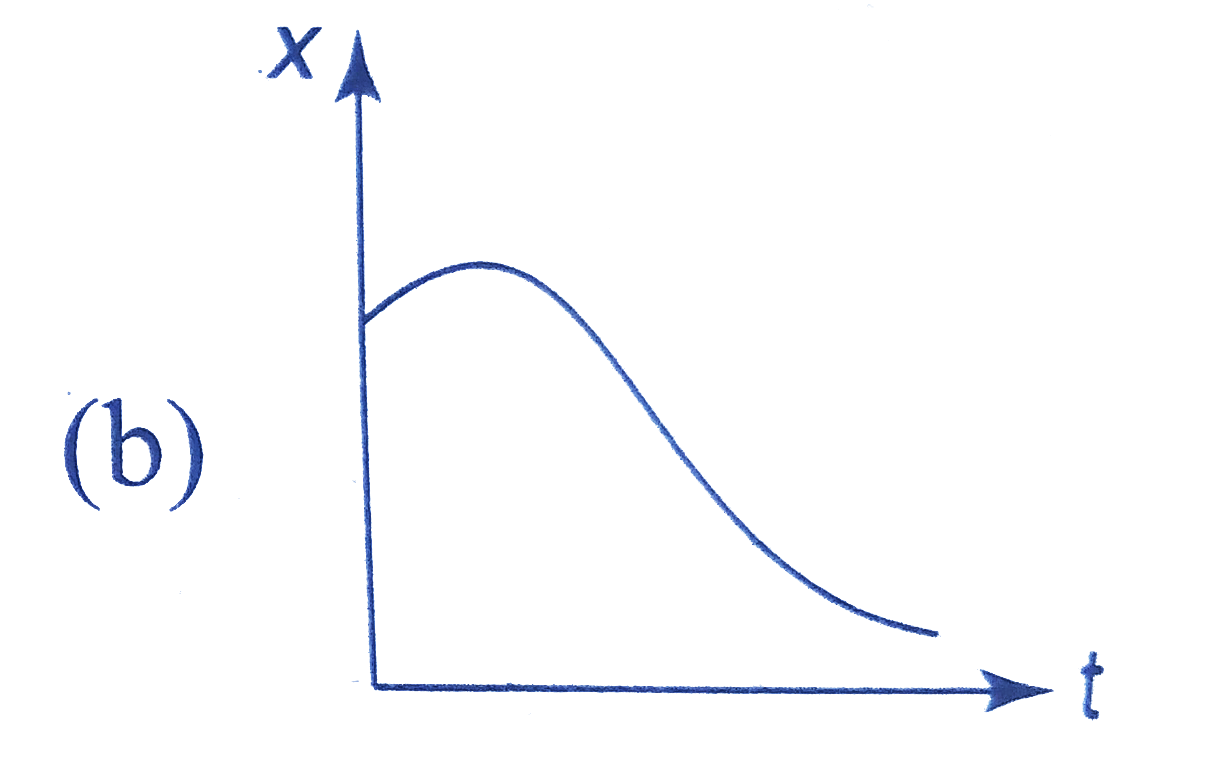
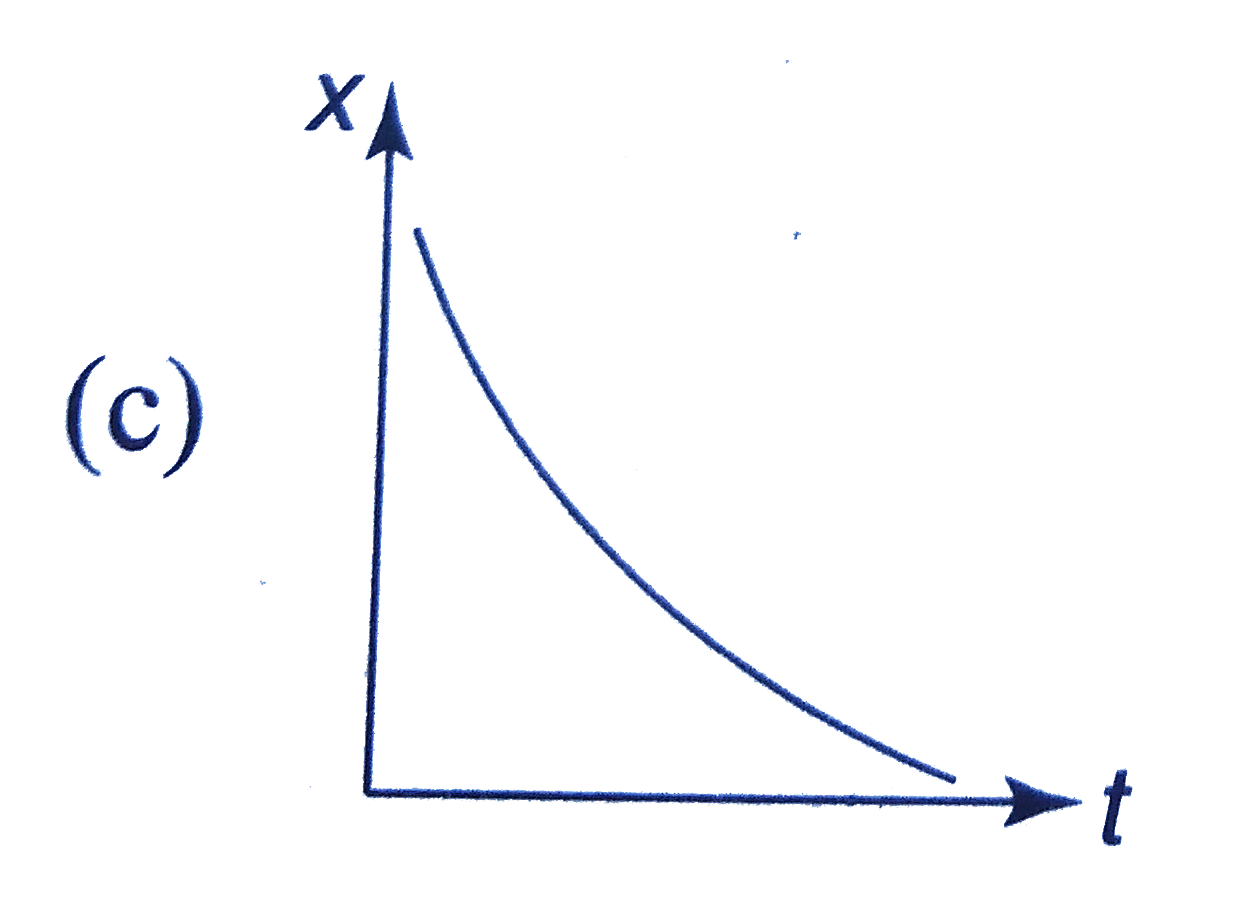
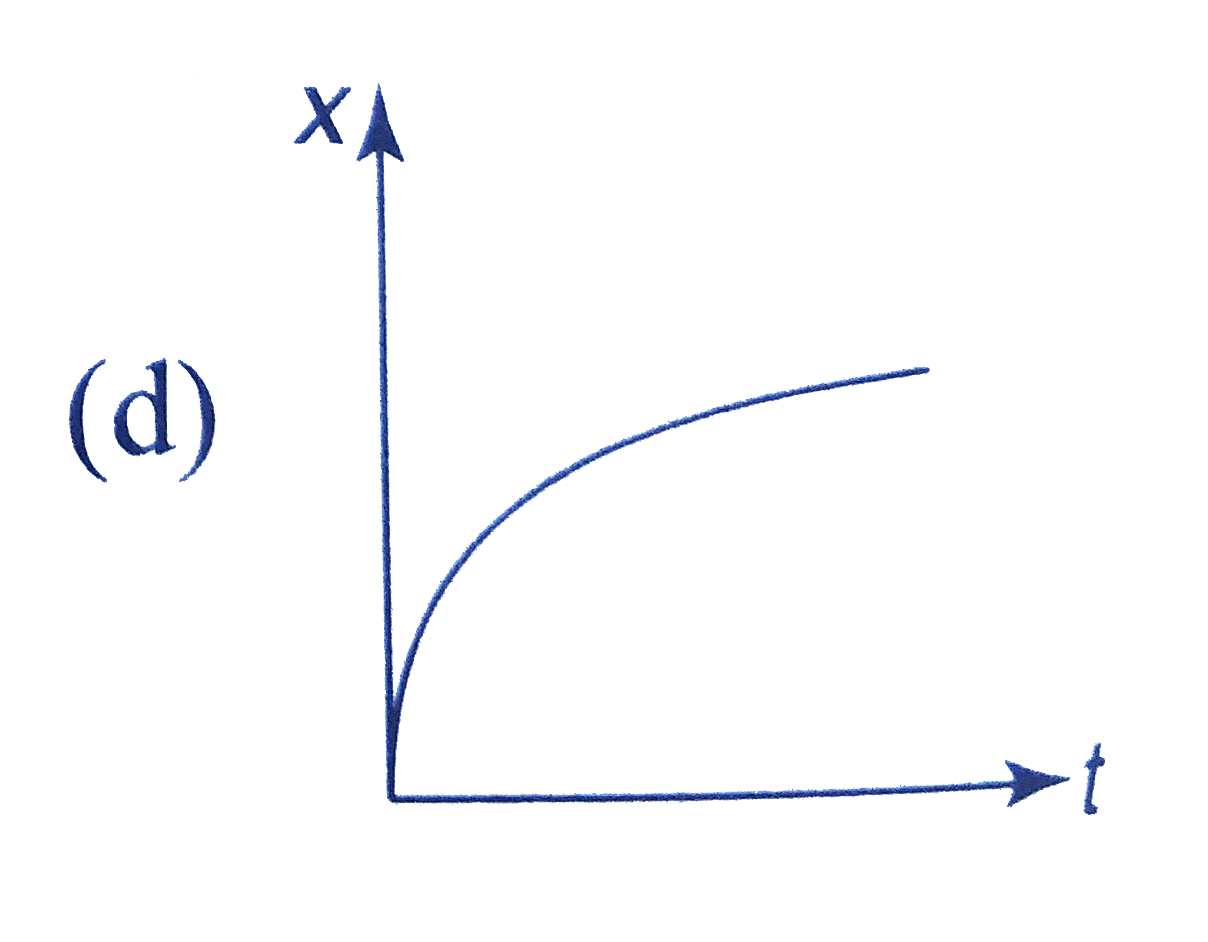
  2. Among the four graphs shown in the figure there is only one graph for ...

    Text Solution

    |

  3. The acceleration-time graph of a particle moving in a straight line is...

    Text Solution

    |

  4. The graph of displacement versus time is shown. Its corresponding velo...

    Text Solution

    |

  5. The graph shown the variation of velocity of a rocket with time. Then,...

    Text Solution

    |

  6. The acceleration of a particle starting from rest and travelling along...

    Text Solution

    |

  7. A particle starting from rest. Its acceleration (a) versus time (t) is...

    Text Solution

    |

  8. Figure gives the velocity-time graph. This shows that the body is.

    Text Solution

    |

  9. A ball is thrown straight up with a velocity at t = 0 and returns to e...

    Text Solution

    |

  10. The diagram shows the displacement-time graph for a particle moving in...

    Text Solution

    |

  11. The graph shows position as a function of time for two trains running ...

    Text Solution

    |

  12. A lift is going up. The variation in the speed of the lift is as given...

    Text Solution

    |

  13. Acceleration versus time graph for four objects are shown below. All a...

    Text Solution

    |

  14. Figure shows the position the graph for a particle in one dimensional ...

    Text Solution

    |

  15. The velocity time graph of a body moving along a straight line is show...

    Text Solution

    |

  16. The velocity-time plot is shown in figure. Find the average speed in t...

    Text Solution

    |

  17. Figure shows the graph of acceleration of particle as a function of ti...

    Text Solution

    |

  18. The velocity-time graph of a body is given below. Find the average vel...

    Text Solution

    |

  19. The velocity-time graph of a body moving along straight line is as fol...

    Text Solution

    |

  20. The velocity-time graph of a linear motion os shown figure. The distan...

    Text Solution

    |