A
 .
.B
 .
.C
 .
.D
 .
.Text Solution
Verified by Experts
The correct Answer is:


Topper's Solved these Questions
GENERAL KINEMATICS AND MOTION IN ONE DIMENSION
A2Z|Exercise Problem Based On Mixed Concepts|30 VideosGENERAL KINEMATICS AND MOTION IN ONE DIMENSION
A2Z|Exercise Assertion Reasoning|20 VideosGENERAL KINEMATICS AND MOTION IN ONE DIMENSION
A2Z|Exercise Relative Motion In One Dimension|20 VideosFLUID MECHANICS
A2Z|Exercise Chapter Test|29 VideosGRAVITATION
A2Z|Exercise Chapter Test|29 Videos
Similar Questions
Explore conceptually related problems
A2Z-GENERAL KINEMATICS AND MOTION IN ONE DIMENSION-Understanding Motion Through Graphs
- The velocity-time graph of a body moving along straight line is as fol...
Text Solution
|
- The velocity-time graph of a linear motion os shown figure. The distan...
Text Solution
|
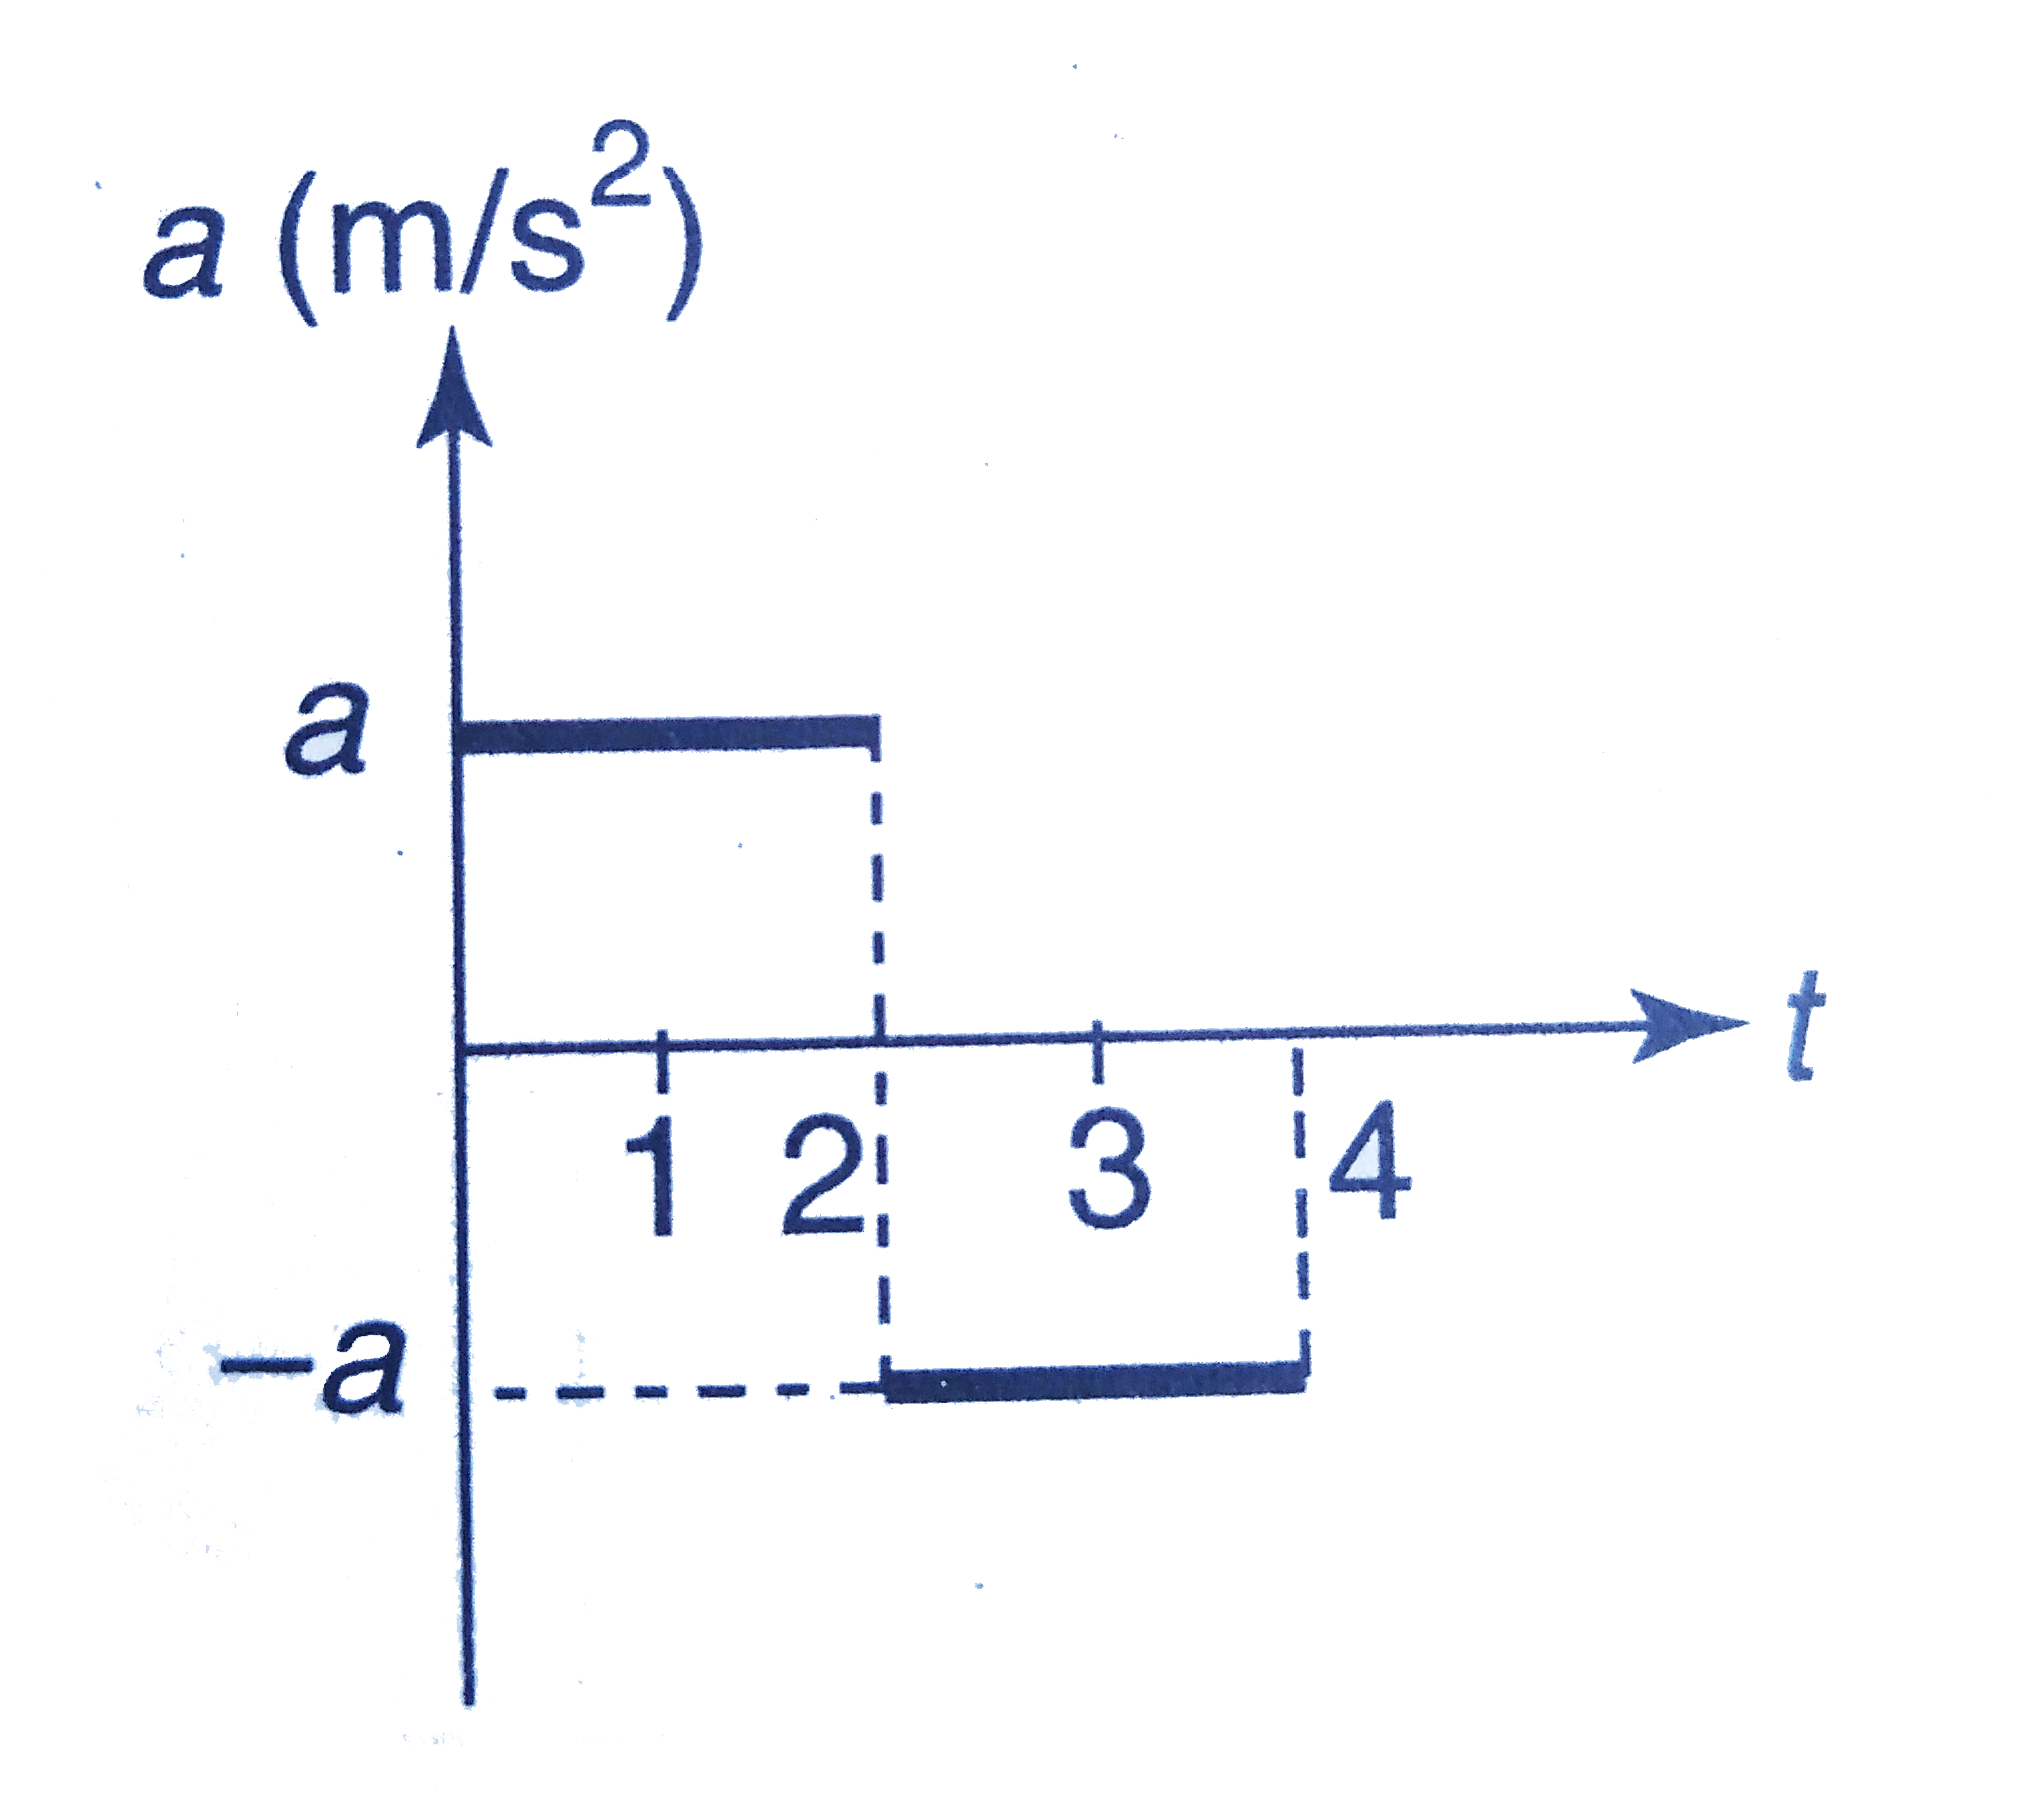
- A particle starts from rest and undergoes an acceleration as shown in ...
Text Solution
|
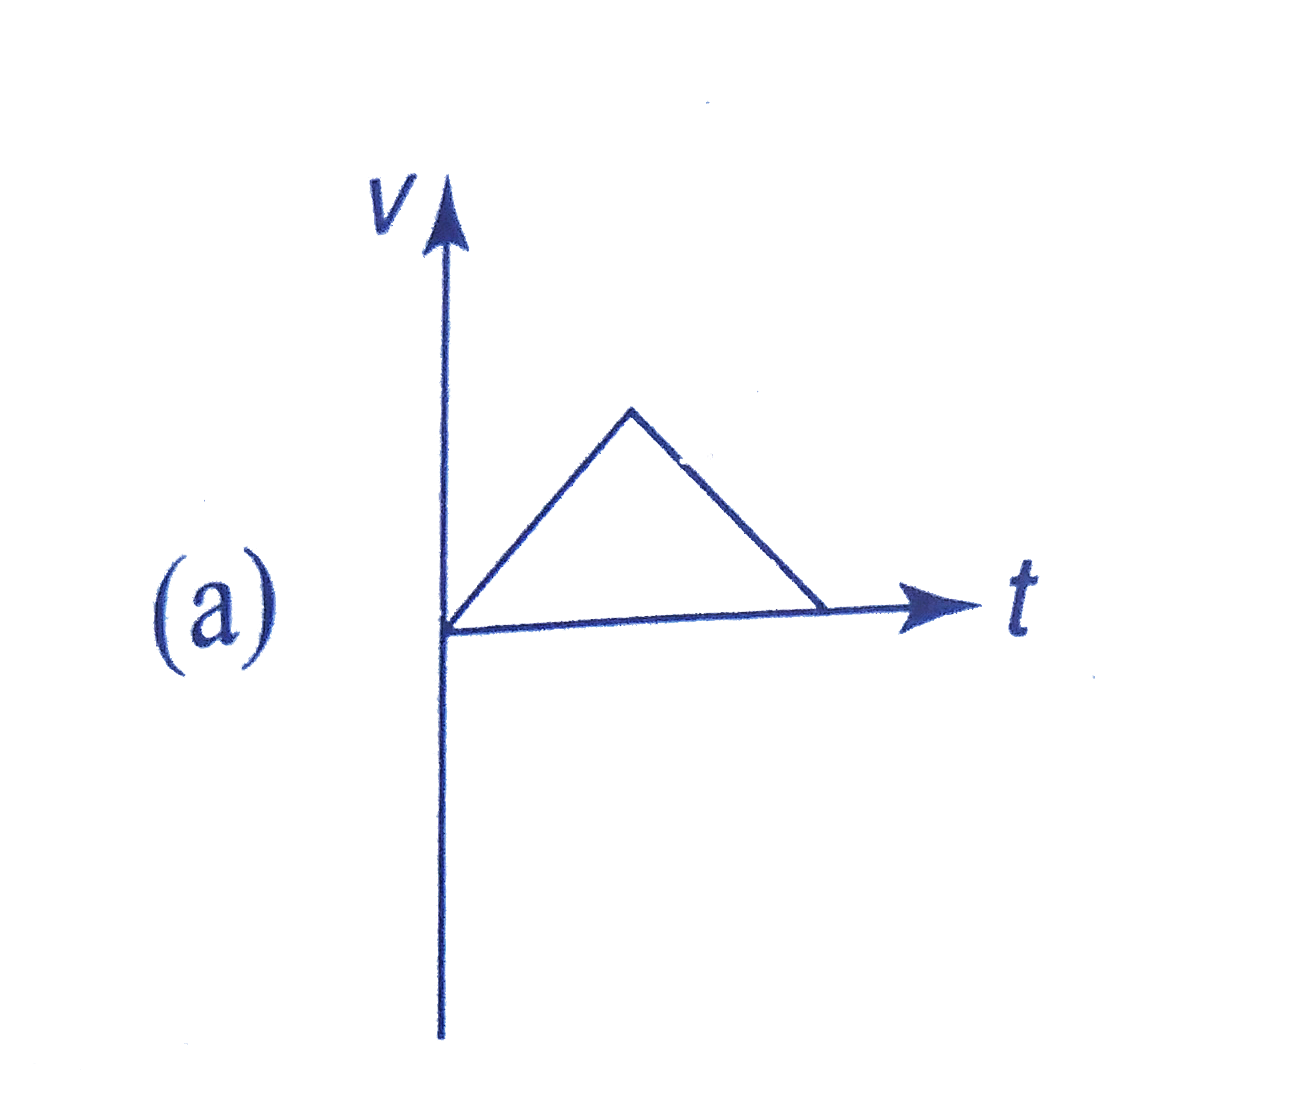
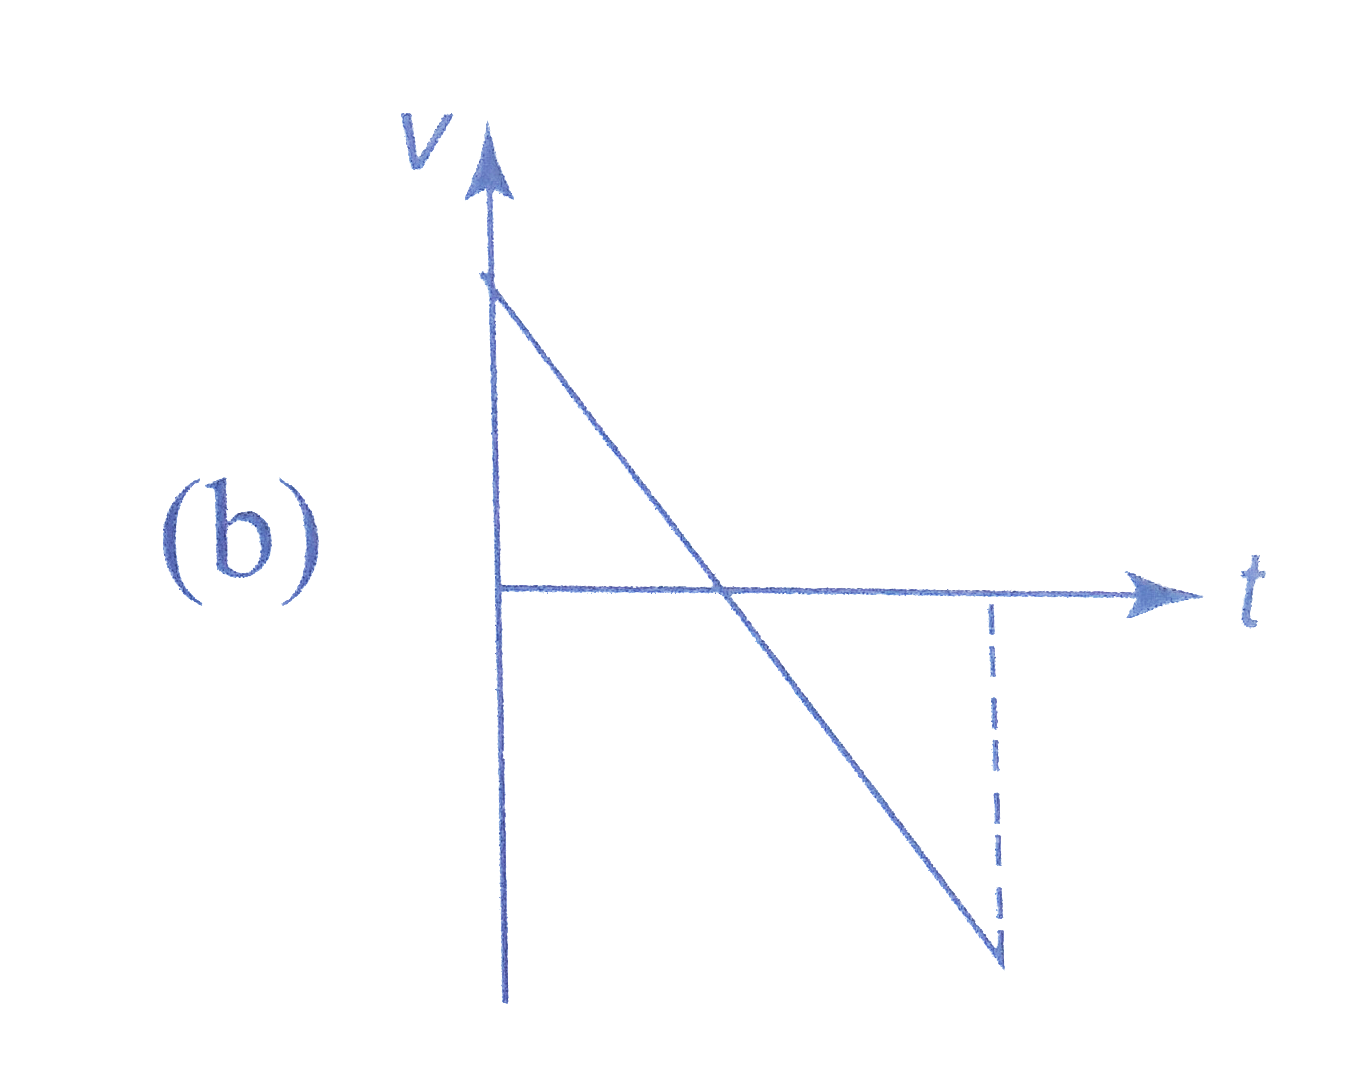
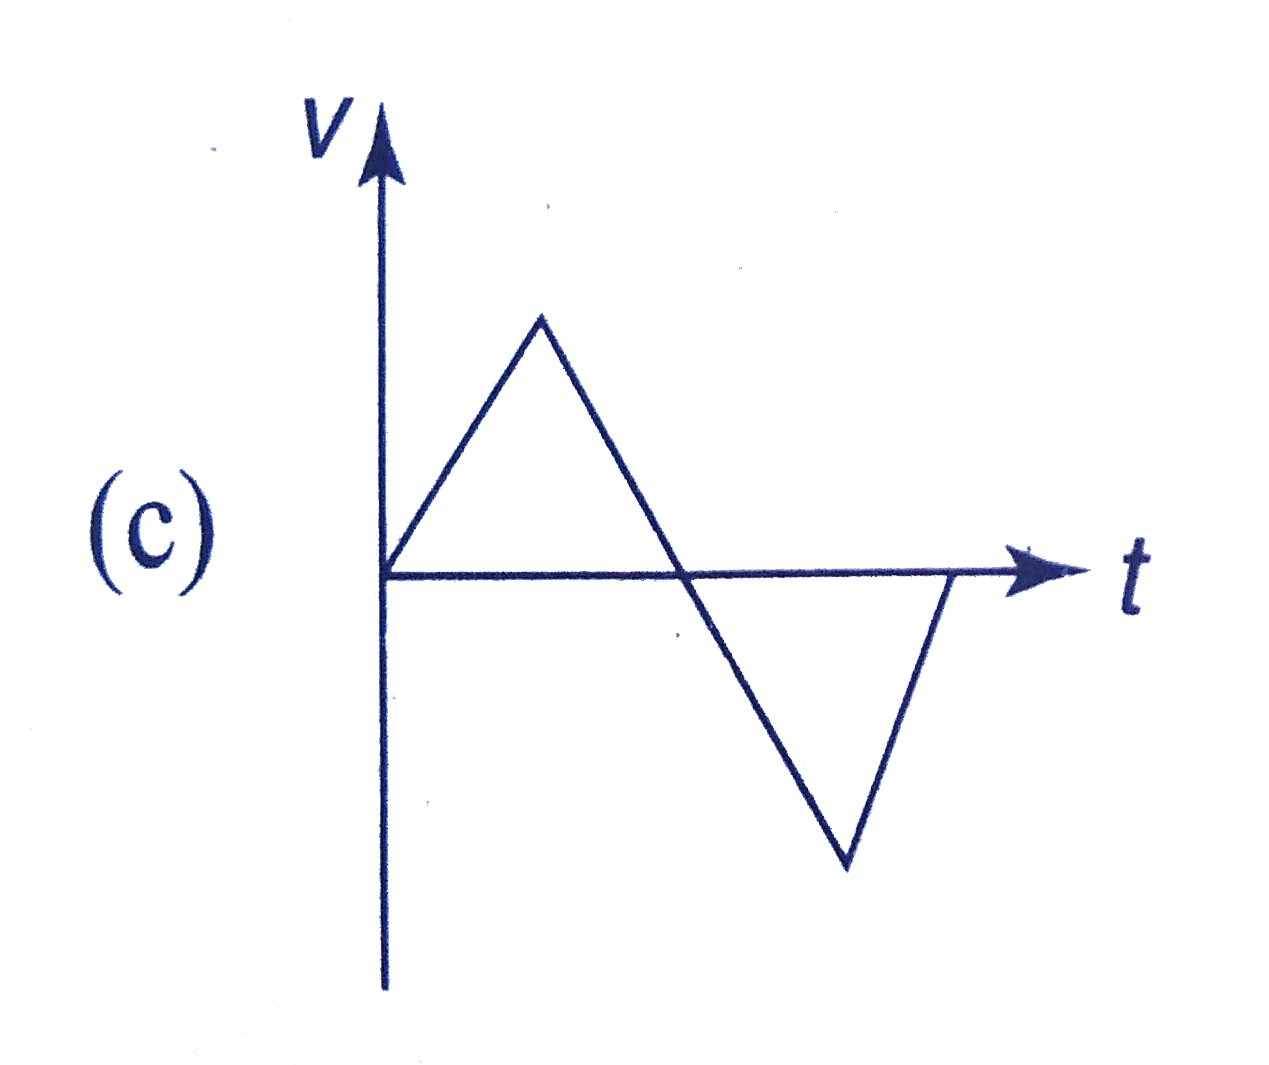
- Which of the following graphs show the v - t graph of a ball thrown up...
Text Solution
|
- Figure shows a velocity-time graph. This shows that.
Text Solution
|
- A paratrooper id dropped from an airplane. After some time his parachu...
Text Solution
|
- The plot shows the position (x) as a function of time (t) for two trai...
Text Solution
|
- The graph to the right is a plot of position versus time. For which le...
Text Solution
|
- Figure shows the position of a particle moving on the x-axis as a func...
Text Solution
|
- A particle moves rectilinearly with a constant acceleration 1 m//s^2. ...
Text Solution
|
- In figure shown, the graph shows the variation of acceleration of body...
Text Solution
|
- Refer Q.139. The average acceleration of the body from t = 0 to t = 15...
Text Solution
|
- Velocity v of a particle moving along x axis as a function of time is ...
Text Solution
|
- Refer Q.141 find the displacement of the particle after 3 s.
Text Solution
|
- Figure shows the position time graph for a particle in one dimensional...
Text Solution
|
- Refer Q. 143, What is the average velocity of the particle from 4 s to...
Text Solution
|
- Refer Q.143. Starting from t = 0, what is the displacement of the part...
Text Solution
|
- In which of the graphs both net displacement and velocity are negative...
Text Solution
|
- Refer Q.146. In which of the graphs the particle may return to its ini...
Text Solution
|
- Each of the three graphs represents acceleration versus time for an ob...
Text Solution
|