Text Solution
Verified by Experts


Topper's Solved these Questions
PRADEEP-MOTION-NCERT Exercises
- An athlete complete one round of a circular track of diameter 200 m in...
Text Solution
|
- Joseph jogs from one end A to other end B of a straight 300m road in 2...
Text Solution
|
- Abdul while driving to school, computes the average speed for his trip...
Text Solution
|
- A motorboat starting from rest on a lake acceleration line at a consta...
Text Solution
|
- a driver of a car travelling at 52 km//h applies the brakes and accele...
Text Solution
|
- Figure shows the distance-time graph of three object A, B and C. Study...
Text Solution
|
- A ball is gently dropped from a height of 20m. If its velocity increas...
Text Solution
|
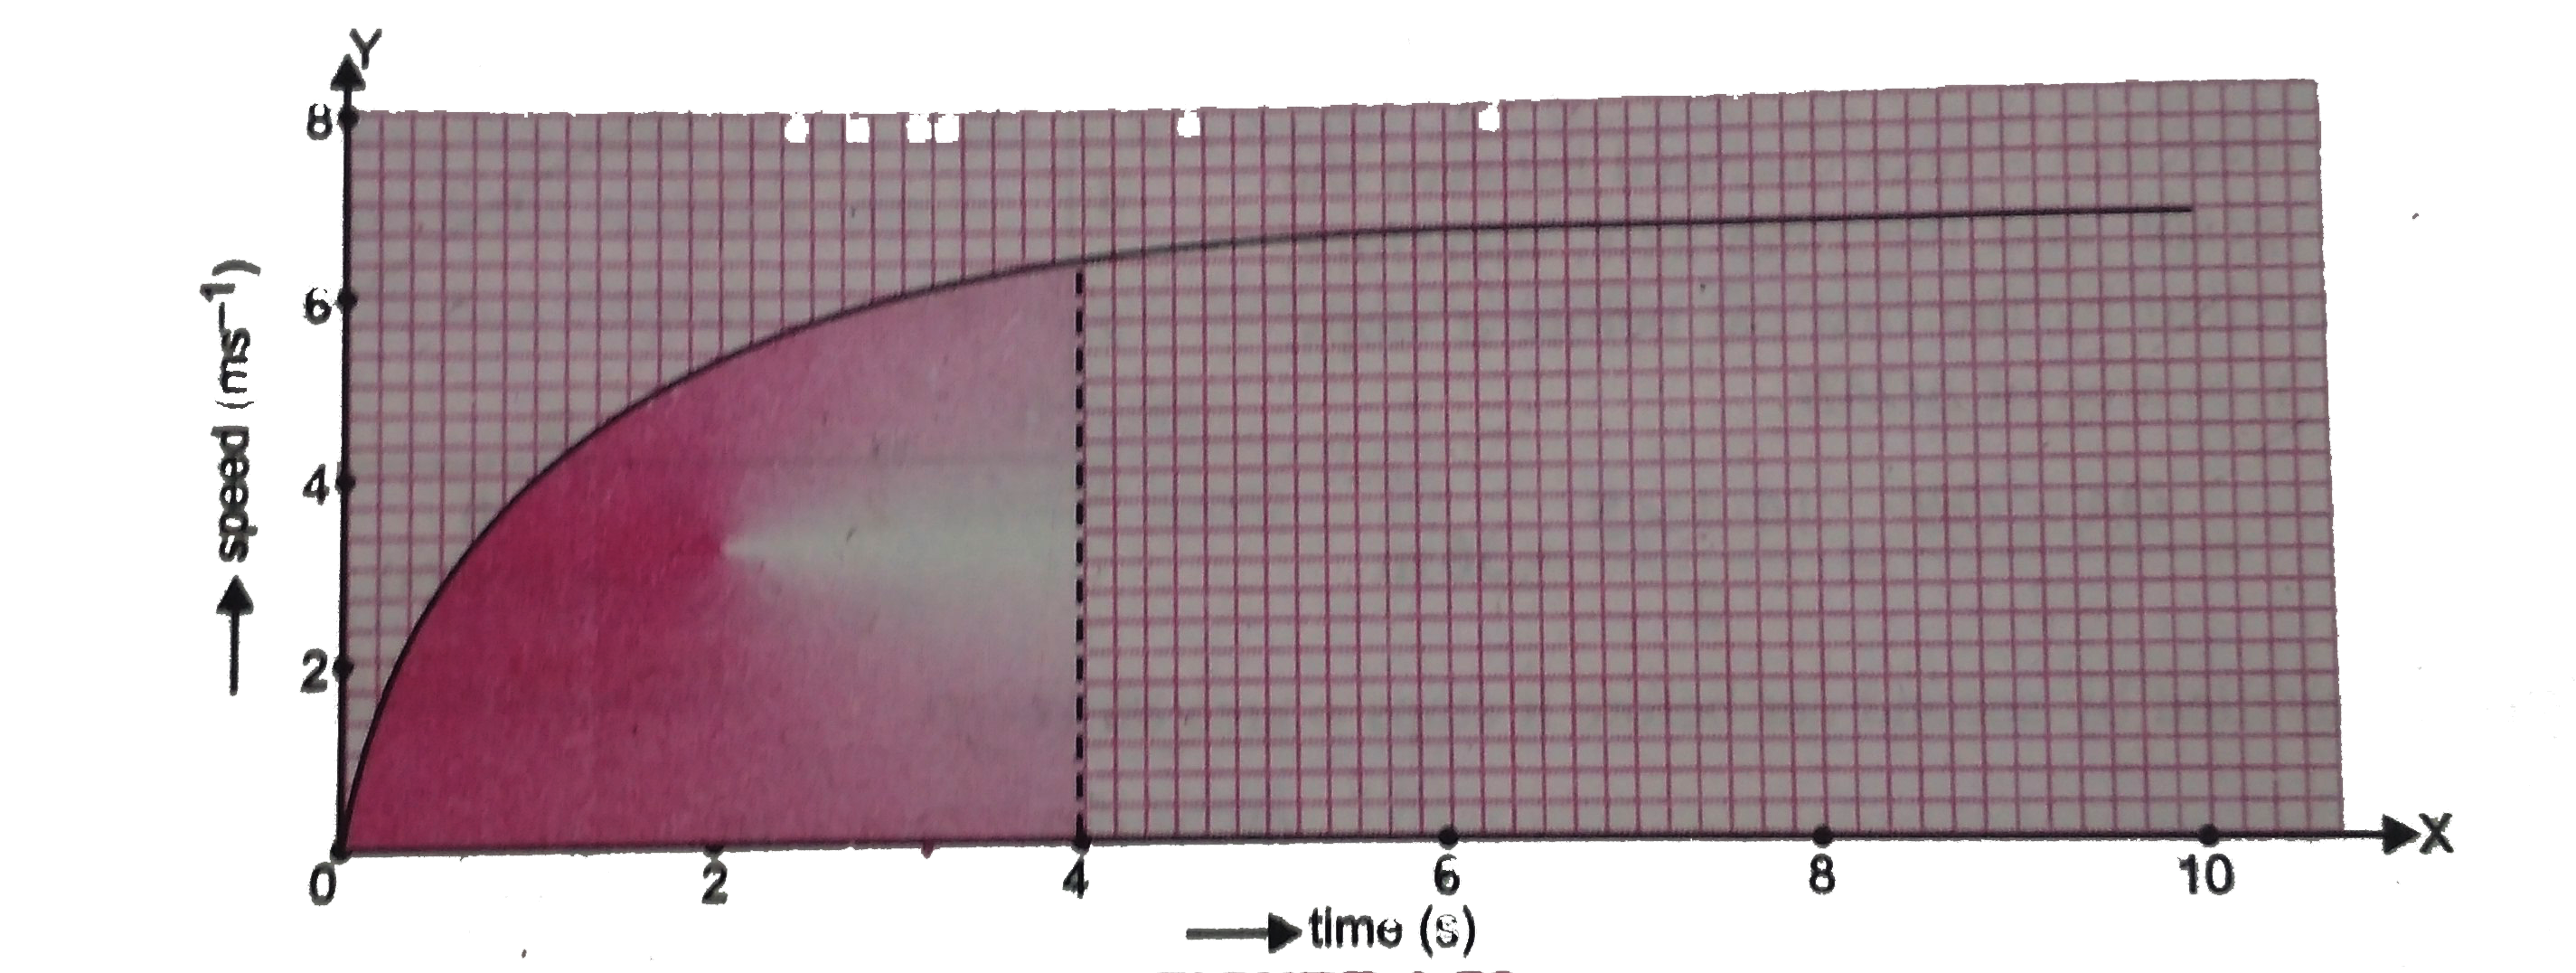
- The speed-time graph for a car is shown is Figure (a) Find how fa...
Text Solution
|
- state which of the following situations are possible and give an examp...
Text Solution
|
- An artificial satellite is moving in a circular orbit of radius 42250 ...
Text Solution
|