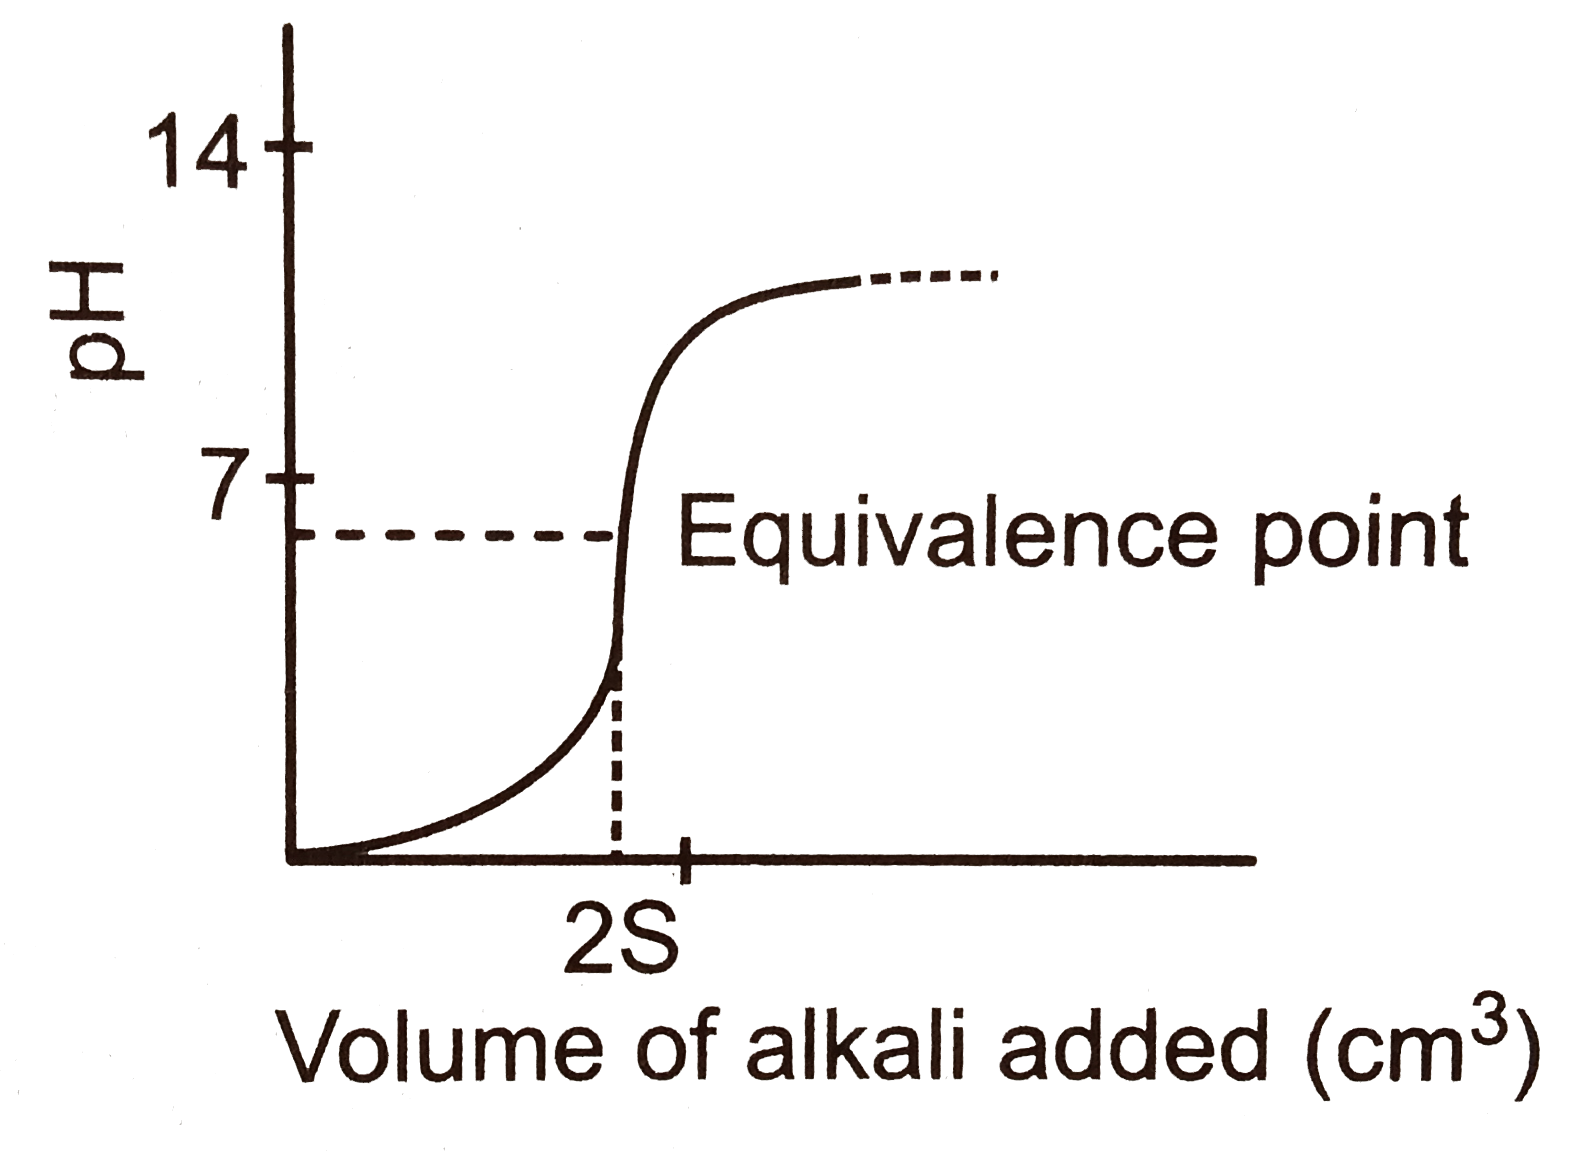
The following graph represents the titration of pH vs volume
The graph given is a stress-strain curve for
In acid-base titration react rapidly to neutralise each other. Equivalence point is a point at which the acid and the base (or oxidising agent and reducing agent) have beem added in equivalent quantities. The end point in the point at which the titration stops. since the purpose of the indicator is to stop the titration close to the point at which the acid and base were added in equivalent quantities, it is important that the equivalent point and the end point be as close as must change colour at a pH close to that of a solution of the salt of the acid base. Singificantly, the pH changes most rapidly near the equivalent point. The exact shape of a titration curve depends on K_(a) and K_(b) of acid and base. The curve represents the titration of
The curve represents the titration of a weak monoprotic acid. Ovar what pH range (s) will the acid being titrated, serve as a buffer when mixed with its salt ? (P) pH 4 -6 (Q) pH 9 -9 (R) pH 12 -13