Text Solution
Verified by Experts
The correct Answer is:


Topper's Solved these Questions
STATISTICS
NAVNEET PUBLICATION - MAHARASHTRA BOARD|Exercise PRACTICE SET 6.3|4 VideosSTATISTICS
NAVNEET PUBLICATION - MAHARASHTRA BOARD|Exercise PRACTICE SET 6.4|4 VideosSTATISTICS
NAVNEET PUBLICATION - MAHARASHTRA BOARD|Exercise PRACTICE SET 6.1|6 VideosSIMILARITY
NAVNEET PUBLICATION - MAHARASHTRA BOARD|Exercise SUBJECTIVE TYPE|20 VideosTHEOREMS
NAVNEET PUBLICATION - MAHARASHTRA BOARD|Exercise CIRCLE|15 Videos
Similar Questions
Explore conceptually related problems
NAVNEET PUBLICATION - MAHARASHTRA BOARD-STATISTICS-PRACTICE SET 6.2
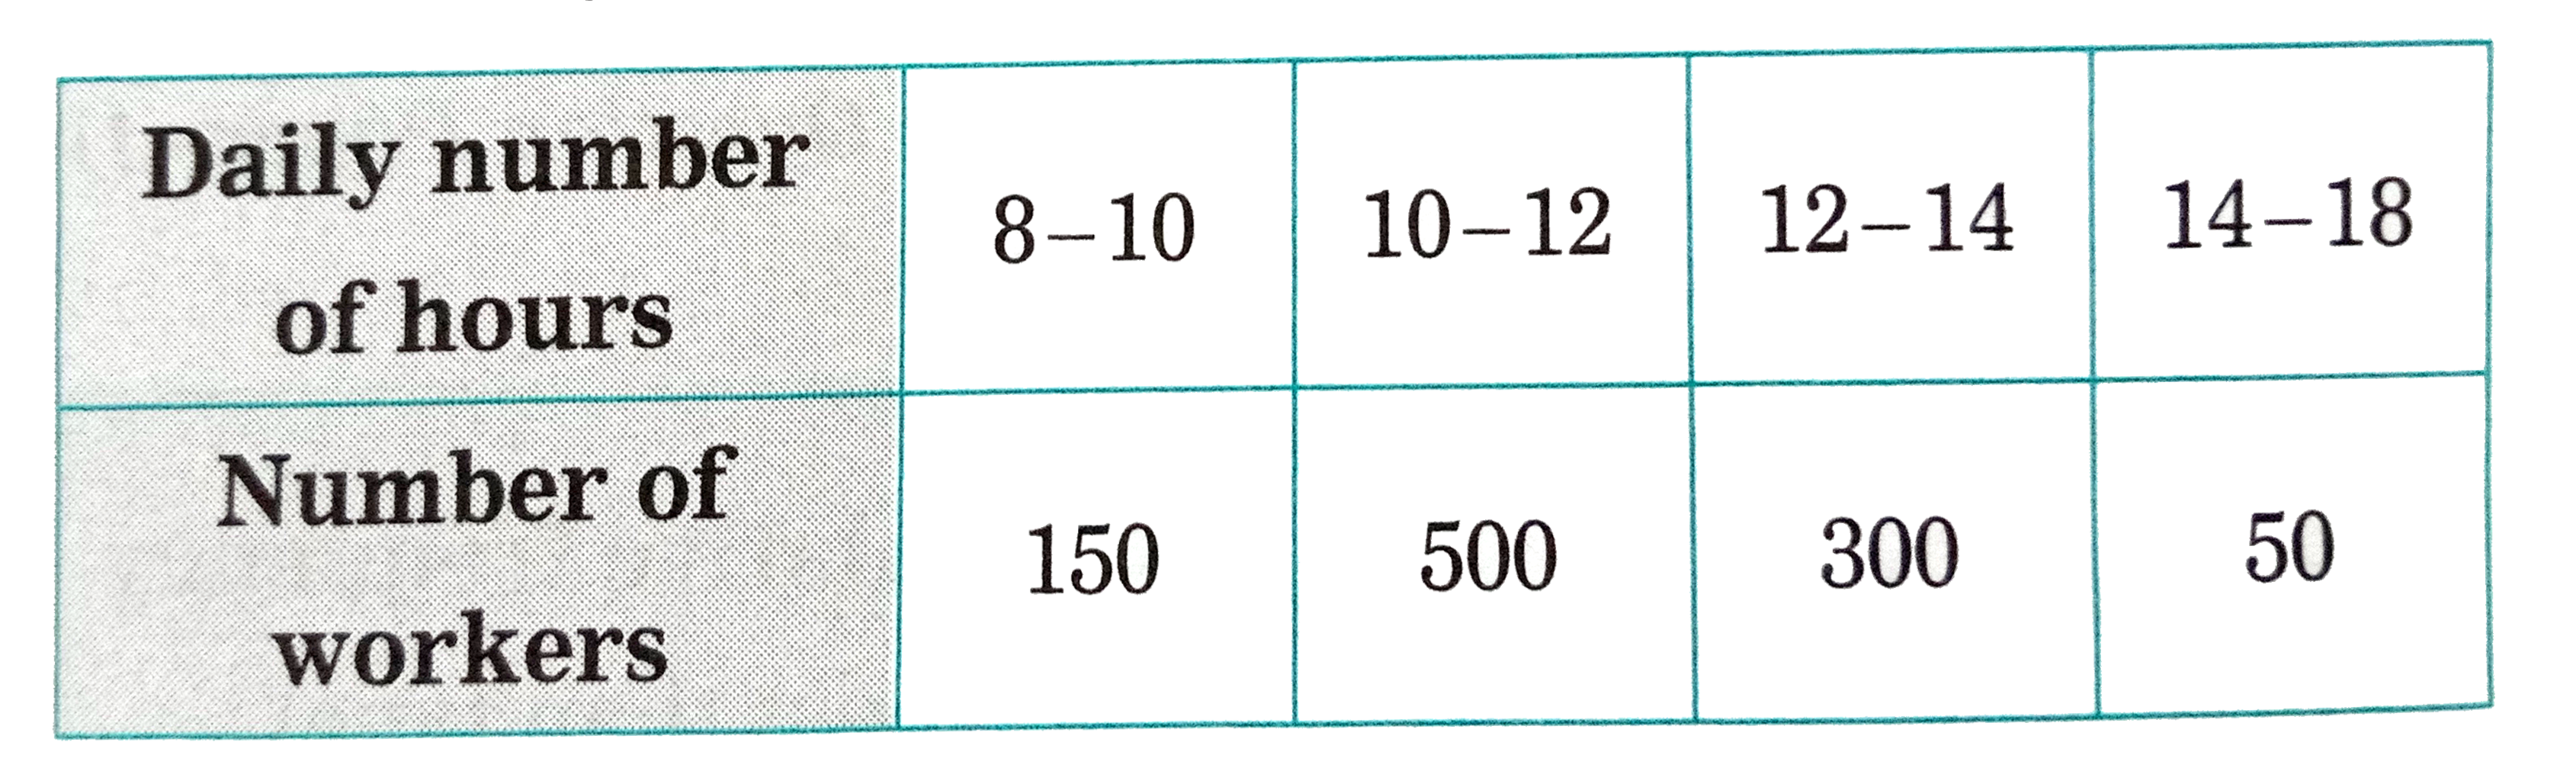
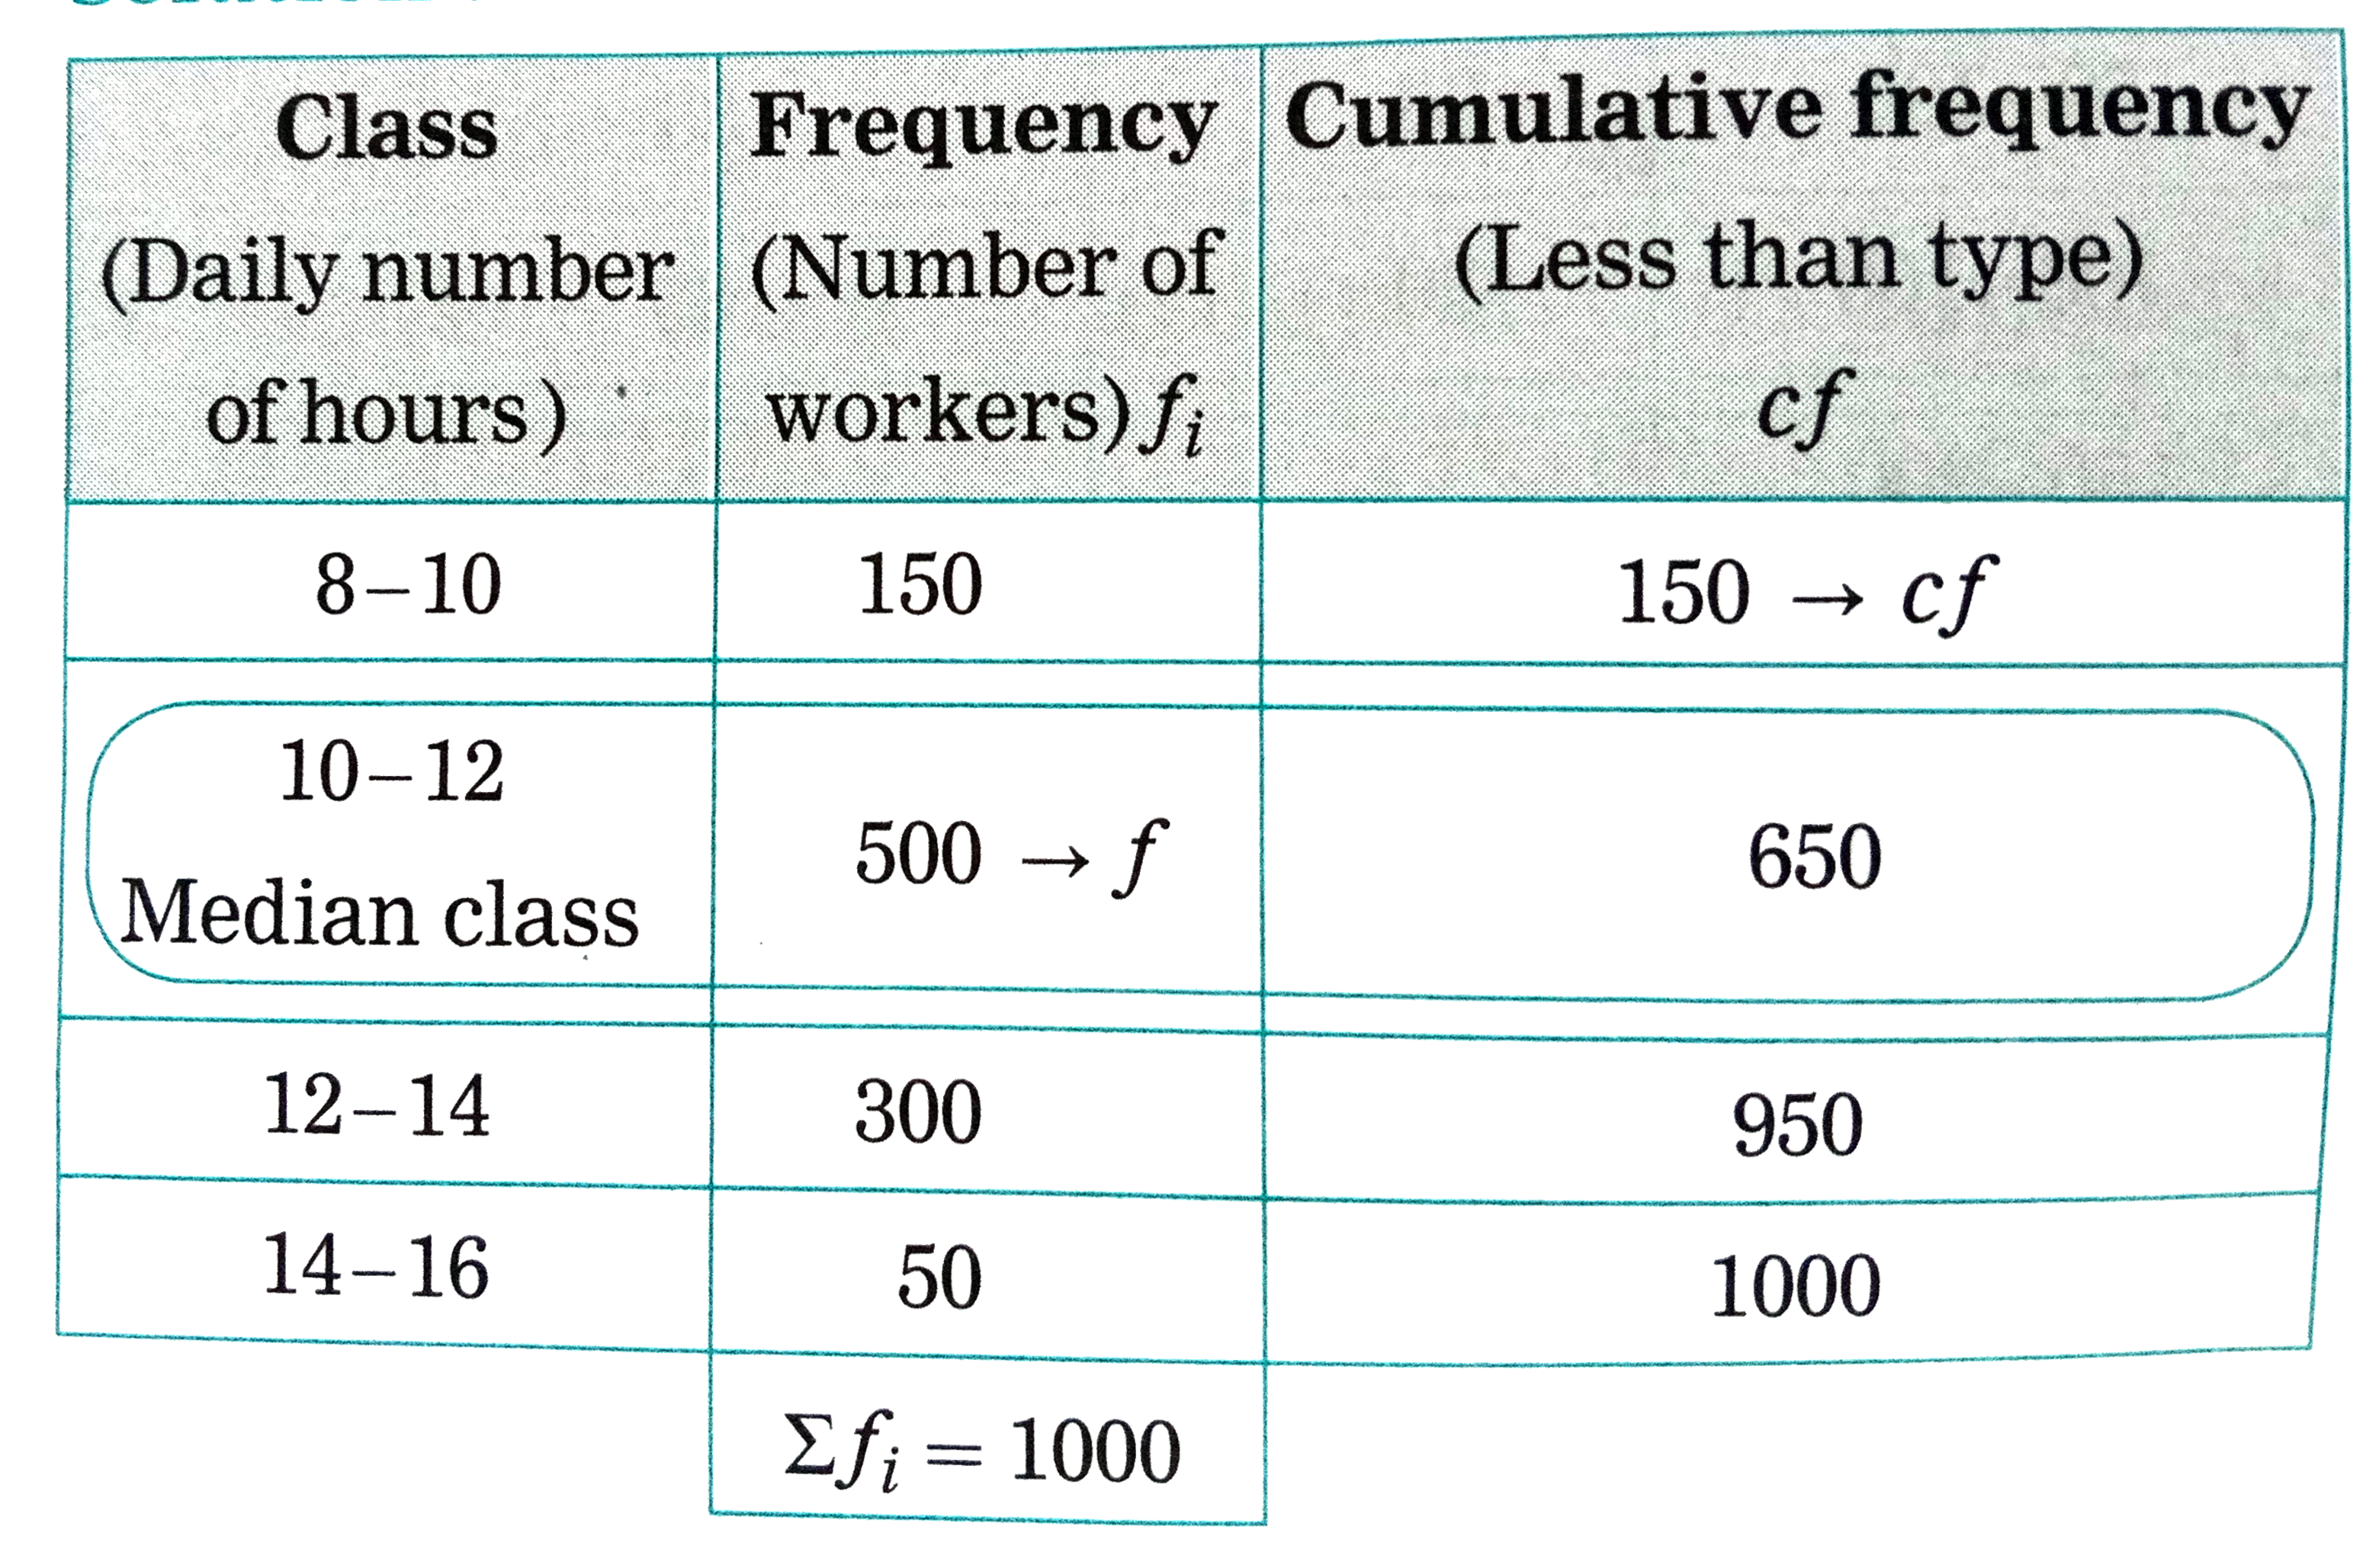
- The following table shows classification of number of workers and the ...
Text Solution
|
- The frequency distribution table shows the number of mango trees in a ...
Text Solution
|
- The following table shows the classification of number of vehicles and...
Text Solution
|
- The production of electric bulbs in different factories is shown in th...
Text Solution
|