Text Solution
Verified by Experts


Topper's Solved these Questions
STATISTICS
NAVNEET PUBLICATION - MAHARASHTRA BOARD|Exercise PRACTICE SET 6.5|3 VideosSTATISTICS
NAVNEET PUBLICATION - MAHARASHTRA BOARD|Exercise PRACTICE SET 6.6|6 VideosSTATISTICS
NAVNEET PUBLICATION - MAHARASHTRA BOARD|Exercise PRACTICE SET 6.3|4 VideosSIMILARITY
NAVNEET PUBLICATION - MAHARASHTRA BOARD|Exercise SUBJECTIVE TYPE|20 VideosTHEOREMS
NAVNEET PUBLICATION - MAHARASHTRA BOARD|Exercise CIRCLE|15 Videos
Similar Questions
Explore conceptually related problems
NAVNEET PUBLICATION - MAHARASHTRA BOARD-STATISTICS-PRACTICE SET 6.4
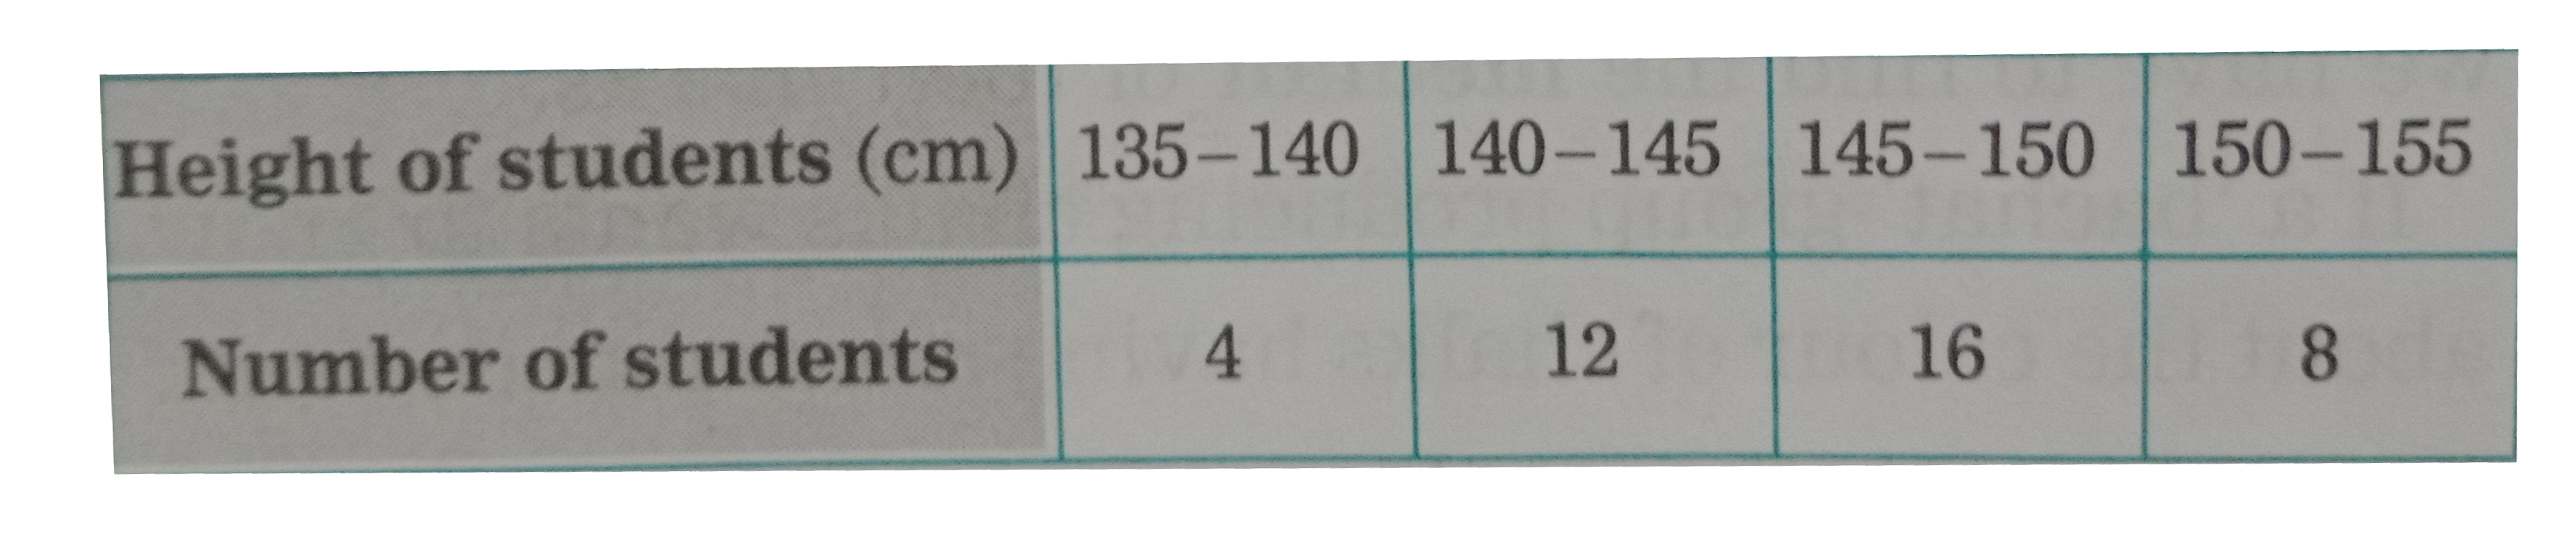
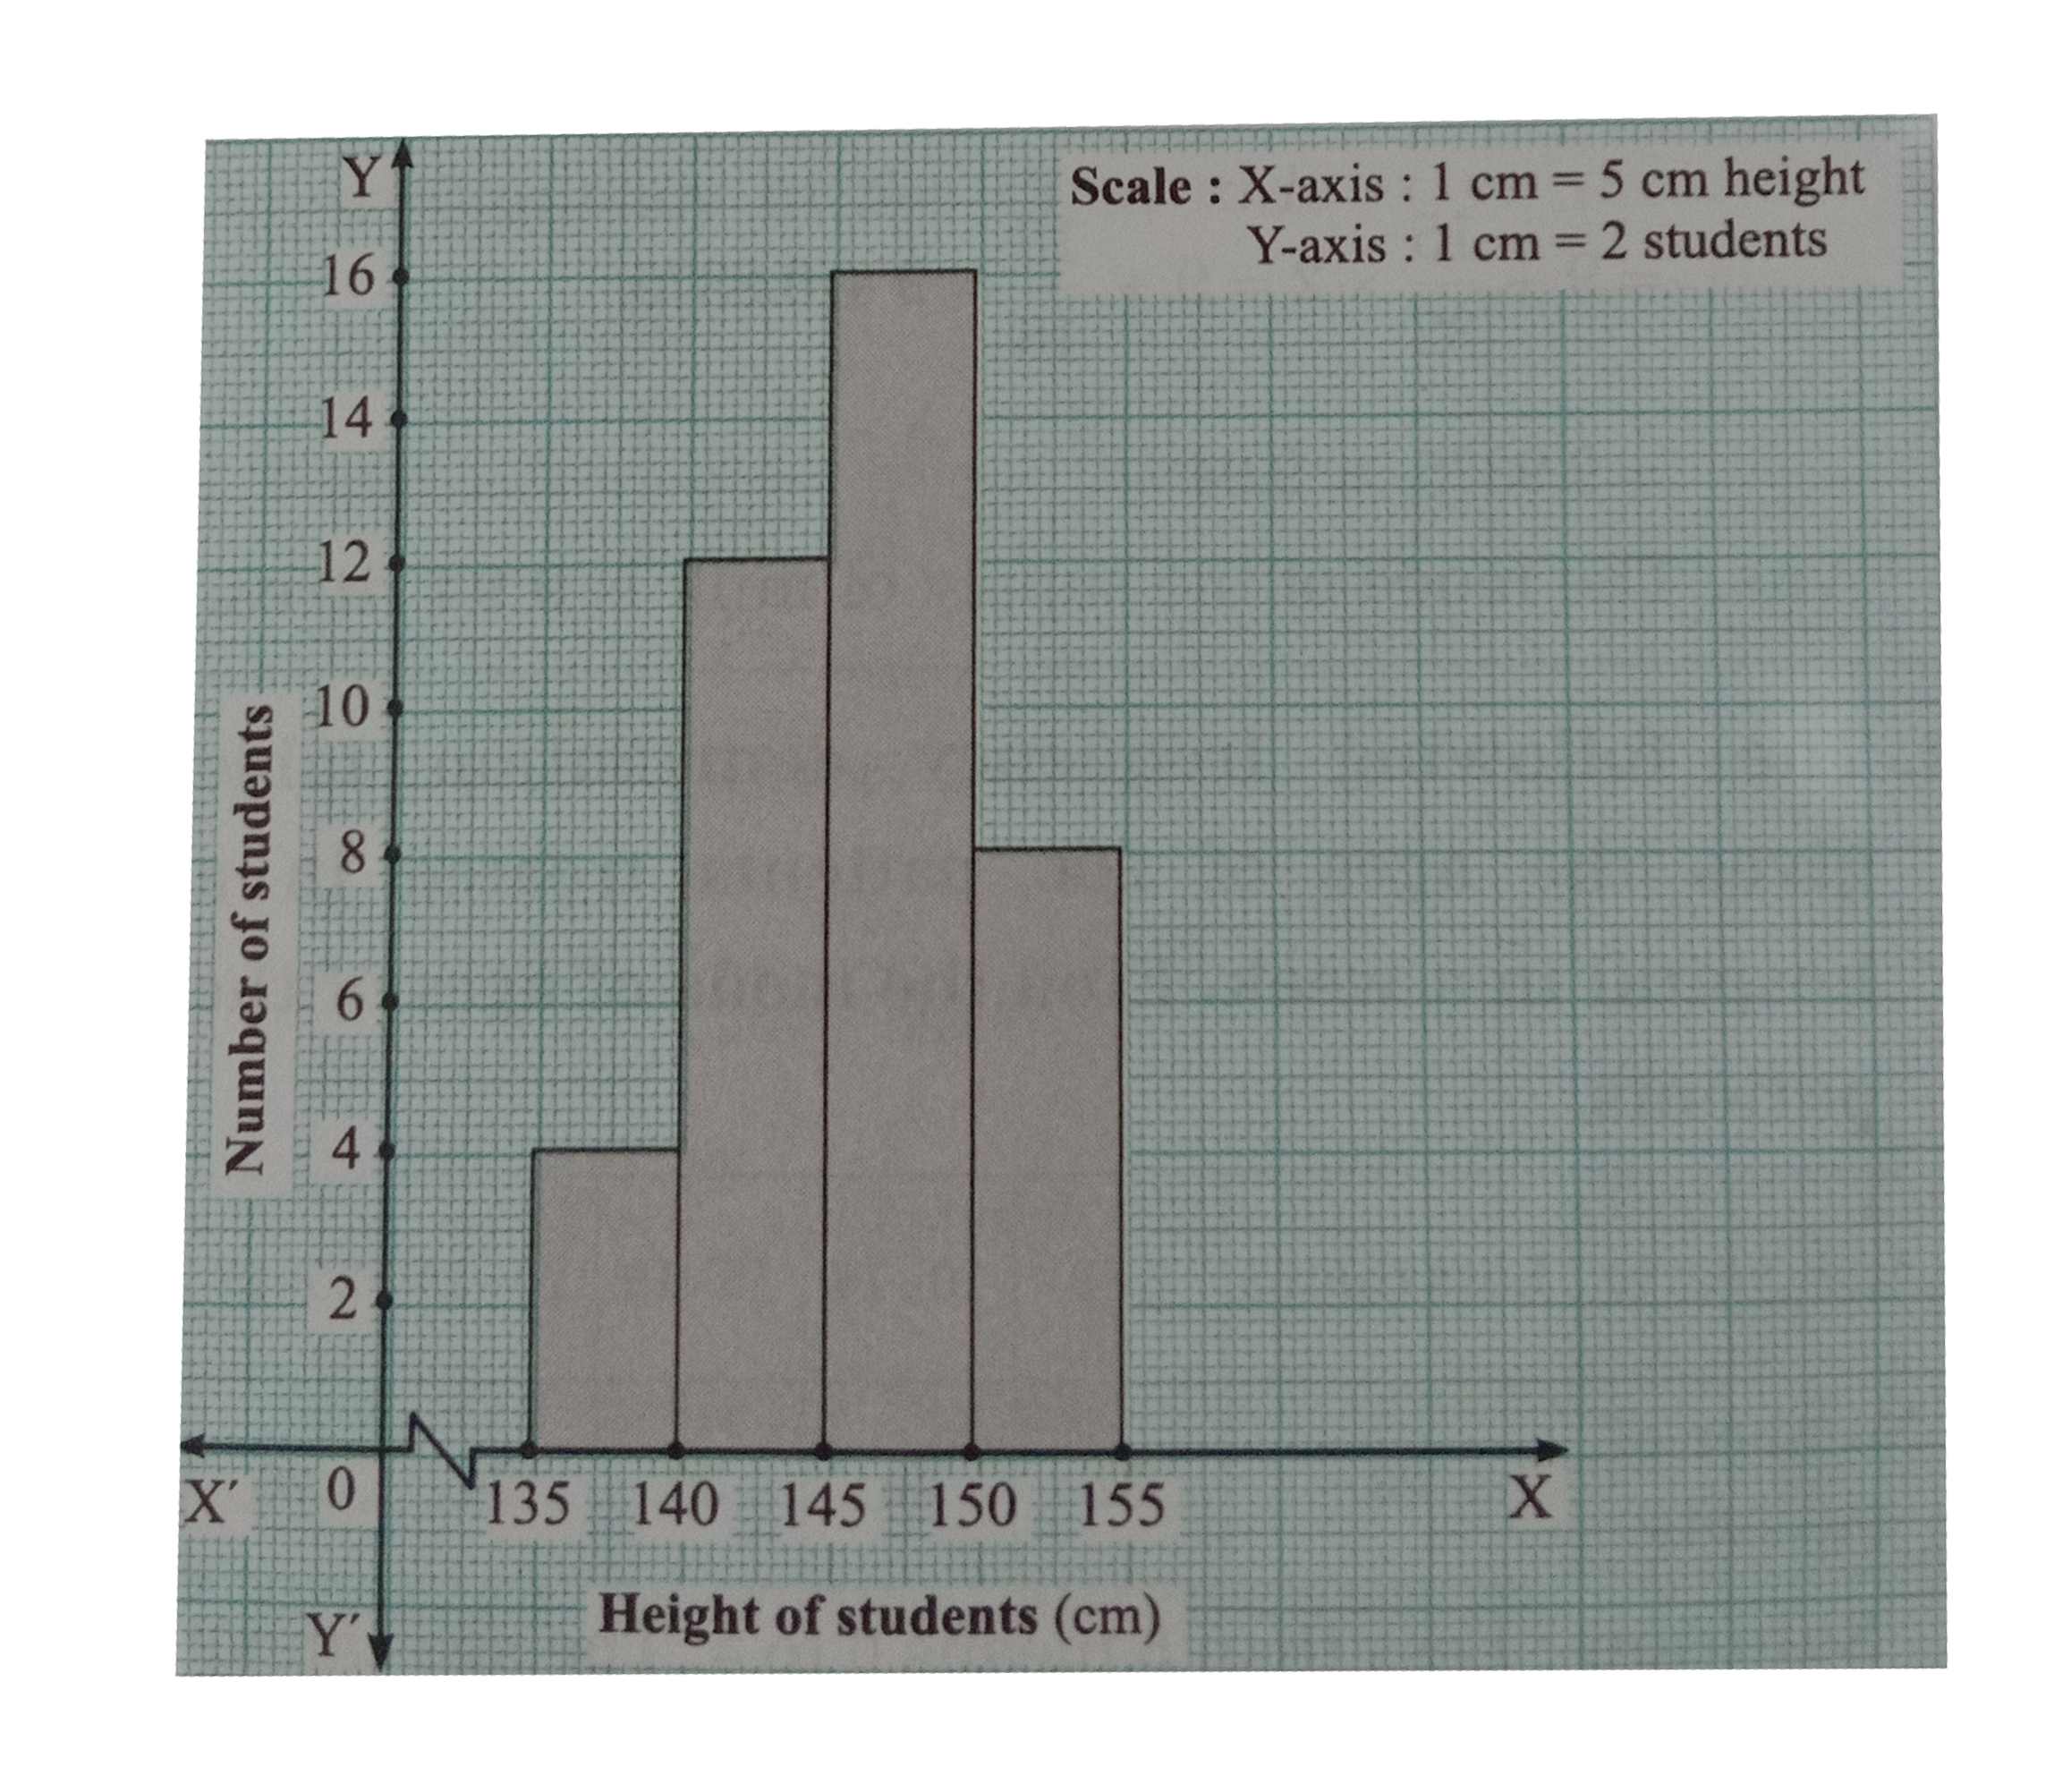
- Draw a histogram of the following data :
Text Solution
|
- The table below show the yield of jowar per acre. Show the data by his...
Text Solution
|
- In the following table, the investment made by 210 families is shown. ...
Text Solution
|
- Time allotted for the preparation of an examination by some students i...
Text Solution
|