A
B
C
D
Text Solution
AI Generated Solution
The correct Answer is:


Topper's Solved these Questions
BEHAVIOUR OF PERFECT GAS & KINETIC THEORY
PRADEEP|Exercise Multiple choice questions-II|8 VideosBEHAVIOUR OF PERFECT GAS & KINETIC THEORY
PRADEEP|Exercise Multiple choice questions-III|12 VideosBEHAVIOUR OF PERFECT GAS & KINETIC THEORY
PRADEEP|Exercise Problems for practice|47 VideosGRAVIATION
PRADEEP|Exercise Assertion-Reason Type Questions|19 Videos
Similar Questions
Explore conceptually related problems
PRADEEP-BEHAVIOUR OF PERFECT GAS & KINETIC THEORY-Multiple choice questions-I
- Diatomic molecules like hydrogen haven energy due to both translationa...
Text Solution
|
- In a diatomic molecule, the rotational energy at given temperature
Text Solution
|
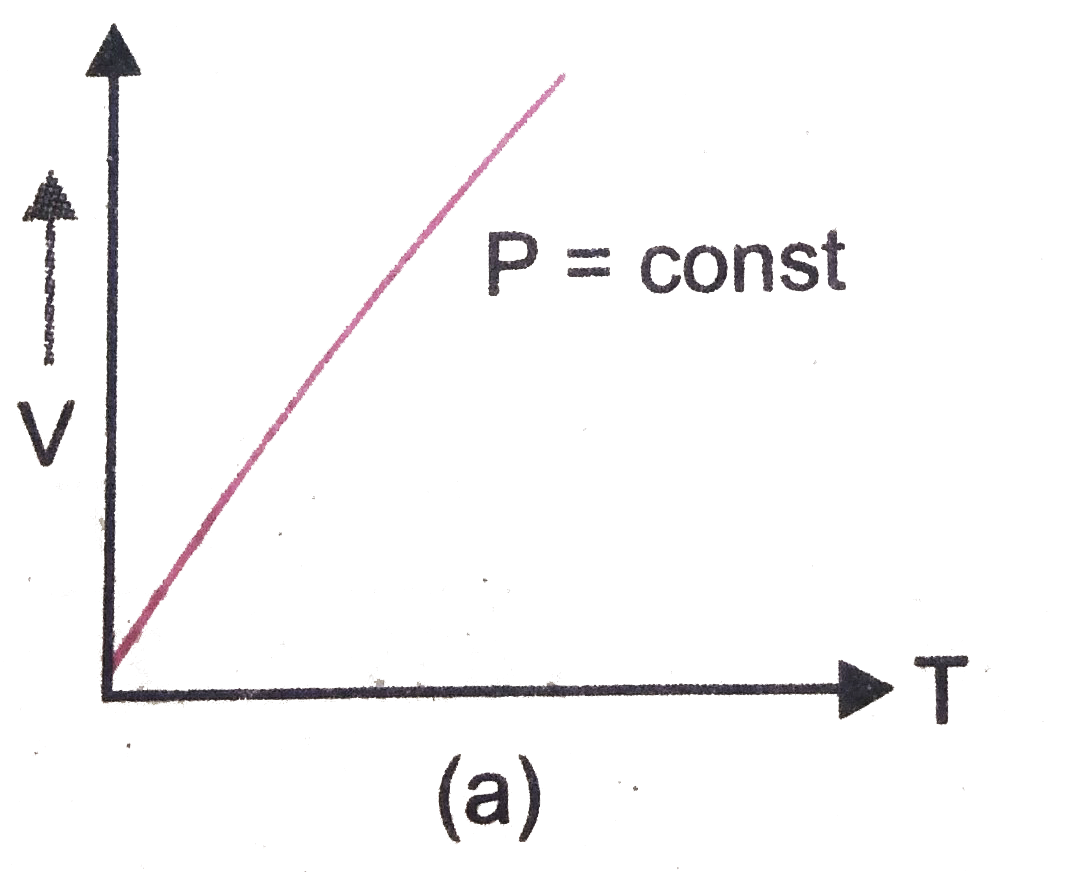
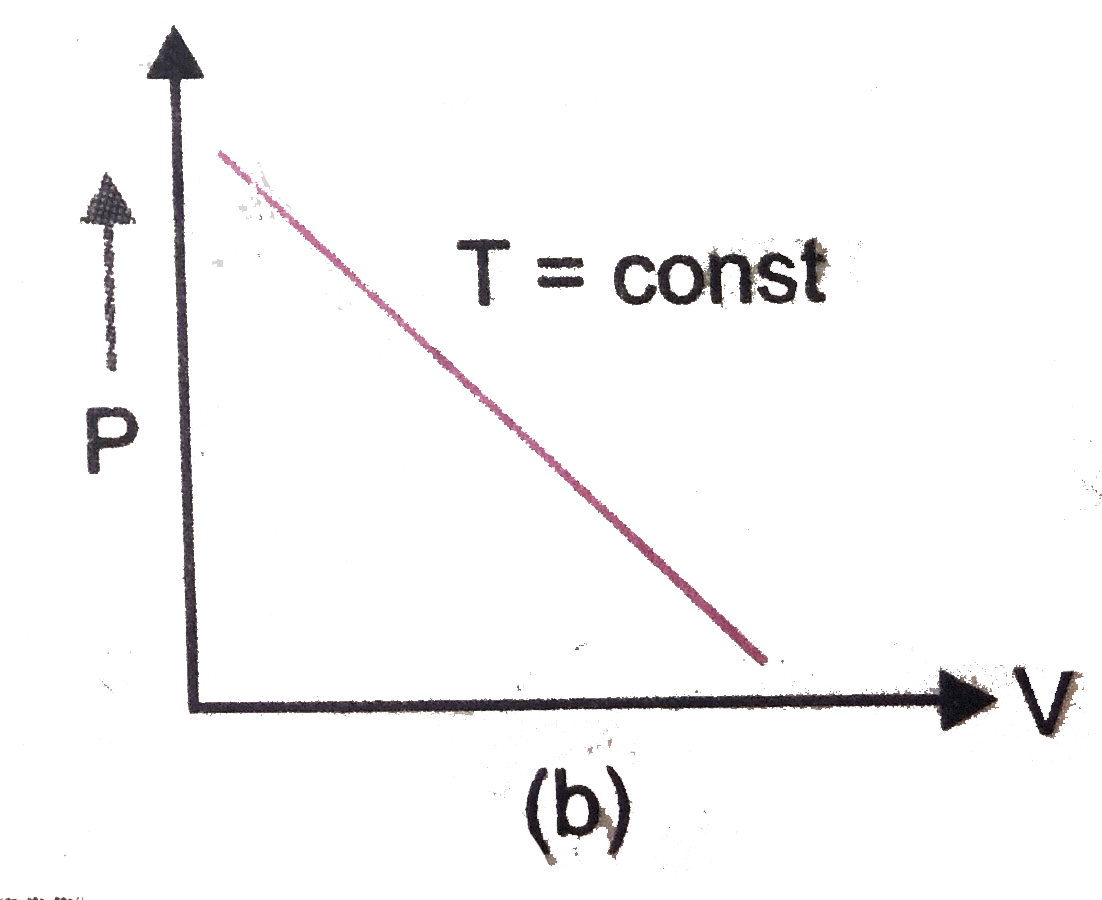
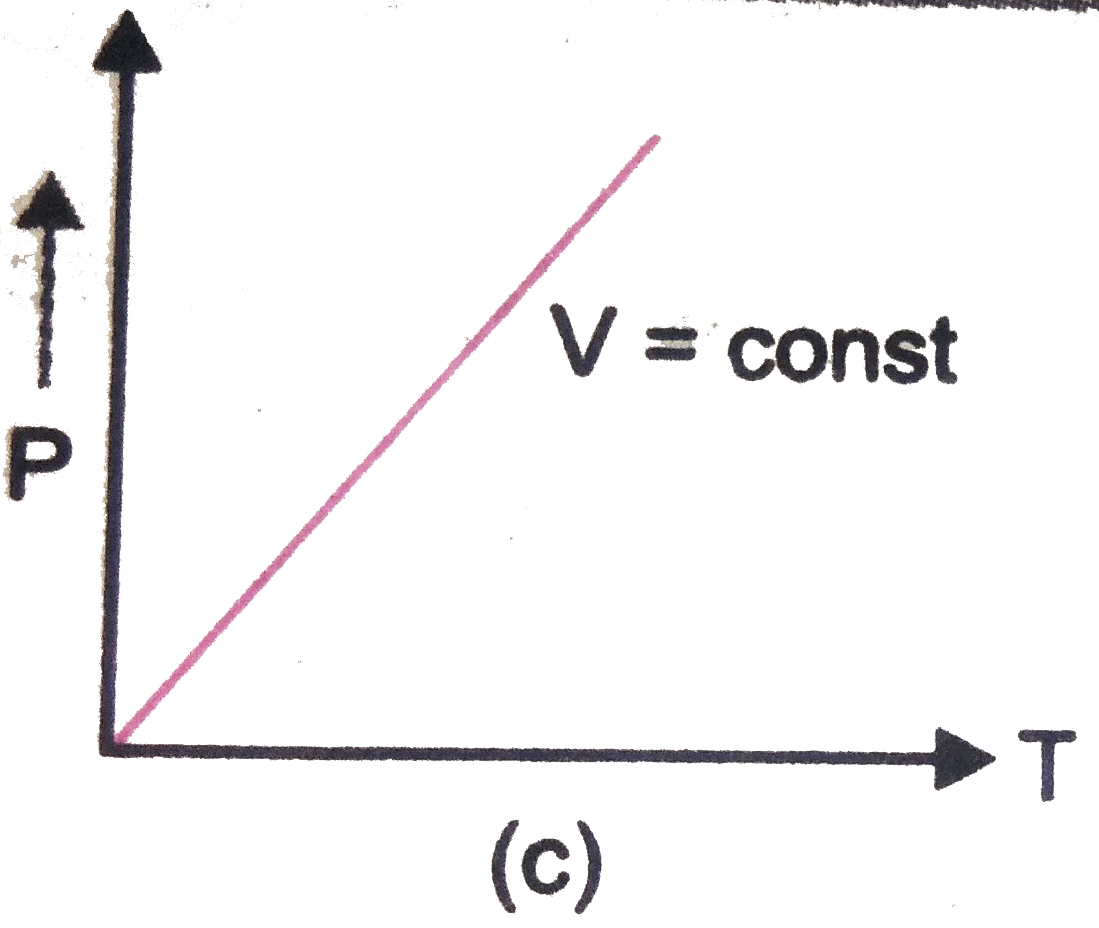
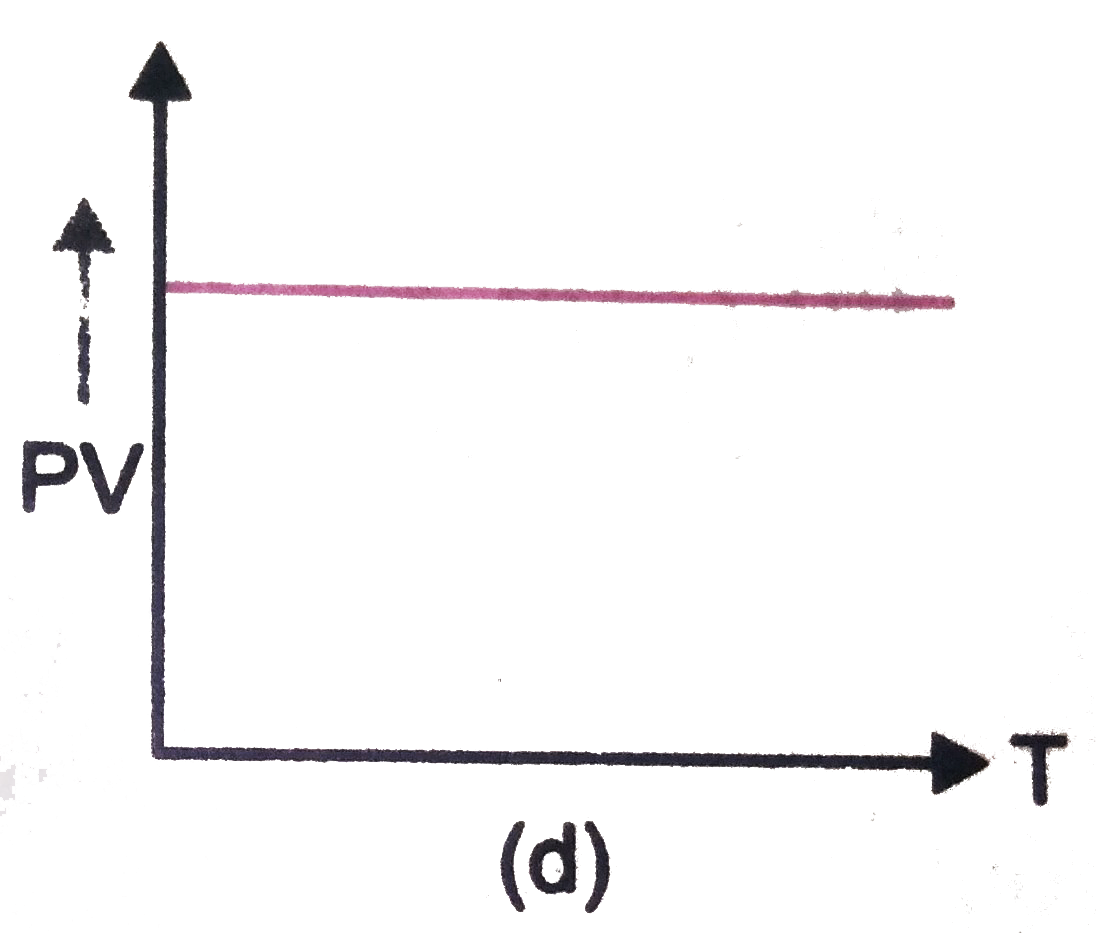
- Which of the following diagrams, Fig. depicts ideal gas behaviour ?
Text Solution
|
- When an ideal gas is compressed adiabatically, is temperature rises th...
Text Solution
|
- A gas at 300 K has pressure 4 xx 10^(-10) N//m^(2). IF k = 1.38 xx 10^...
Text Solution
|
- 16 gram of oxygen, 14 gram of nitrogen and 11 gram of carbon dioxide a...
Text Solution
|
- A gas is found to obey the law P^(2)V = constant. The initial temperat...
Text Solution
|
- The specific heat of the mixture of two gases at constant volume is (1...
Text Solution
|
- The equation of state for 5 g of oxygen at a pressure P and temperatur...
Text Solution
|
- A certain amount of gas is sealed in a glass flask at 1 atmosphere pre...
Text Solution
|
- The temperature of an open room of volume 30 m^(3) increases from 17^(...
Text Solution
|
- When a gas filled in a closed vessel is heated through 1^(@)C, its pre...
Text Solution
|
- Temperature ramaining constant, the pressure of gas is decreased by 20...
Text Solution
|
- At 10^(@)C, the value of the density of a fixed mass of an ideal gas d...
Text Solution
|
- An insulated container of gas has two chambers separated by an insulat...
Text Solution
|
- One litre of oxygen at a pressure of 1 atm and two litres of nitrogen ...
Text Solution
|
- A container with insulating walls is divided into two equal parts by a...
Text Solution
|
- If gas molecules undergo inelastic collision with the walls of contain...
Text Solution
|
- In the given (V-T) diagram, what is the relation between pressure P(1)...
Text Solution
|
- An open glass tube is immersed in mercury in such a way that a lenth o...
Text Solution
|