Text Solution
Verified by Experts


Topper's Solved these Questions
DUAL NATURE OF RADIATION AND MATTER
PRADEEP|Exercise NCERT Exerciese question|1 VideosDUAL NATURE OF RADIATION AND MATTER
PRADEEP|Exercise Short answer|1 VideosCURRENT ELECTRICITY
PRADEEP|Exercise Problems for Practice (B)|2 VideosELECTROMAGNETIC INDUCTION & ALTERNATING CURRENT
PRADEEP|Exercise Multiple Choice Questions|1 Videos
Similar Questions
Explore conceptually related problems
PRADEEP-DUAL NATURE OF RADIATION AND MATTER-Exercise
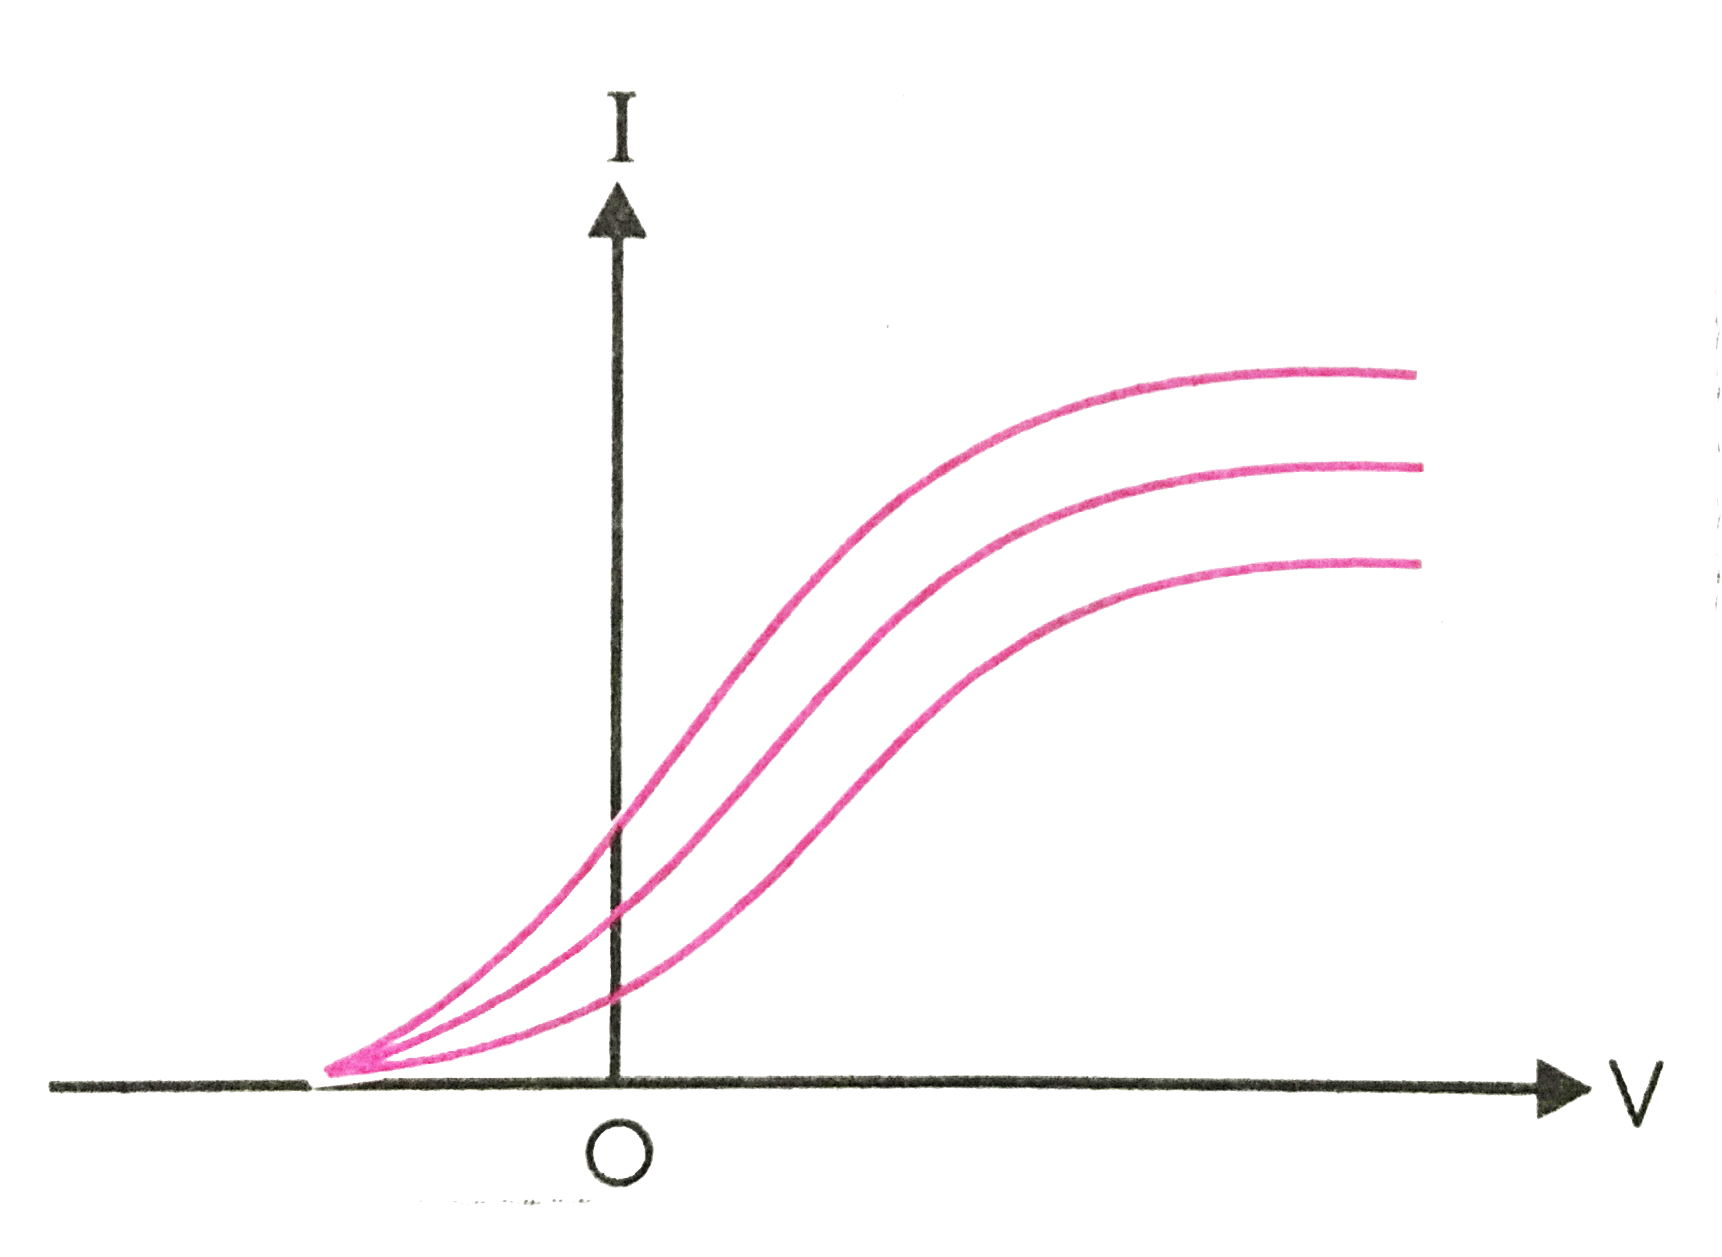
- In an experiment on photoelectic effect, the graph as shown in fig. we...
Text Solution
|
- The photoelectric effect can be explained on the basis of
Text Solution
|
- Which of the following has minimum stopping potential?
Text Solution
|
- When radiation is incident on a photoelectron emitter, the potential i...
Text Solution
|
- Two photons, each of energy 2.5 eV are simultaneously incident on the ...
Text Solution
|
- The maximum velocity of an electron emitted by light of wavelength lam...
Text Solution
|
- The photoelectric work function for a metal surface is 4.125 eV. The c...
Text Solution
|
- The slope of frequency of incident light and stopping potential for a ...
Text Solution
|
- Threshold wavelength for a metal having work function w(0) is lambda. ...
Text Solution
|
- The work function for metals A , B and C are respectively 1.92 eV , 2....
Text Solution
|
- The wavelength of the matter wave is independent of
Text Solution
|
- If E(1), E(2), E(3), E(4) are the respective kinetic energies of elect...
Text Solution
|
- What is de-Broglie wavelength assciated with electron moving under a ...
Text Solution
|
- The minimum energy required by an electron to..........form the metal ...
Text Solution
|
- The maximum kinetic energy of emitted photoelectrons depends on the......
Text Solution
|
- The ratio of number of photoelectrons ejected to the number of the pho...
Text Solution
|
- For given photosenstive material, the photoelectric current is...........
Text Solution
|
- An increase in the frequency of the incident light.............the vel...
Text Solution
|
- The minimum energy required to ejected an electron from the surface of...
Text Solution
|
- In photoelectric effect the energy of the free electron does not depen...
Text Solution
|
- Photon is not a..........but it is a.......... .
Text Solution
|