


Topper's Solved these Questions
DIAGRAMMATIC REPRESENTATION OF DATA
CHHAYA PUBLICATION|Exercise EXERCISE (Long Answer Type Question)|13 VideosDIAGRAMMATIC REPRESENTATION OF DATA
CHHAYA PUBLICATION|Exercise EXERCISE (Very short Answer Type Question)|7 VideosHYPERBOLA
CHHAYA PUBLICATION|Exercise SAMPLE QUESTIONS FOR COMPETITIVE EXAMS|12 Videos
Similar Questions
Explore conceptually related problems
CHHAYA PUBLICATION-DIAGRAMMATIC REPRESENTATION OF DATA-EXERCISE (Very short Answer Type Question)
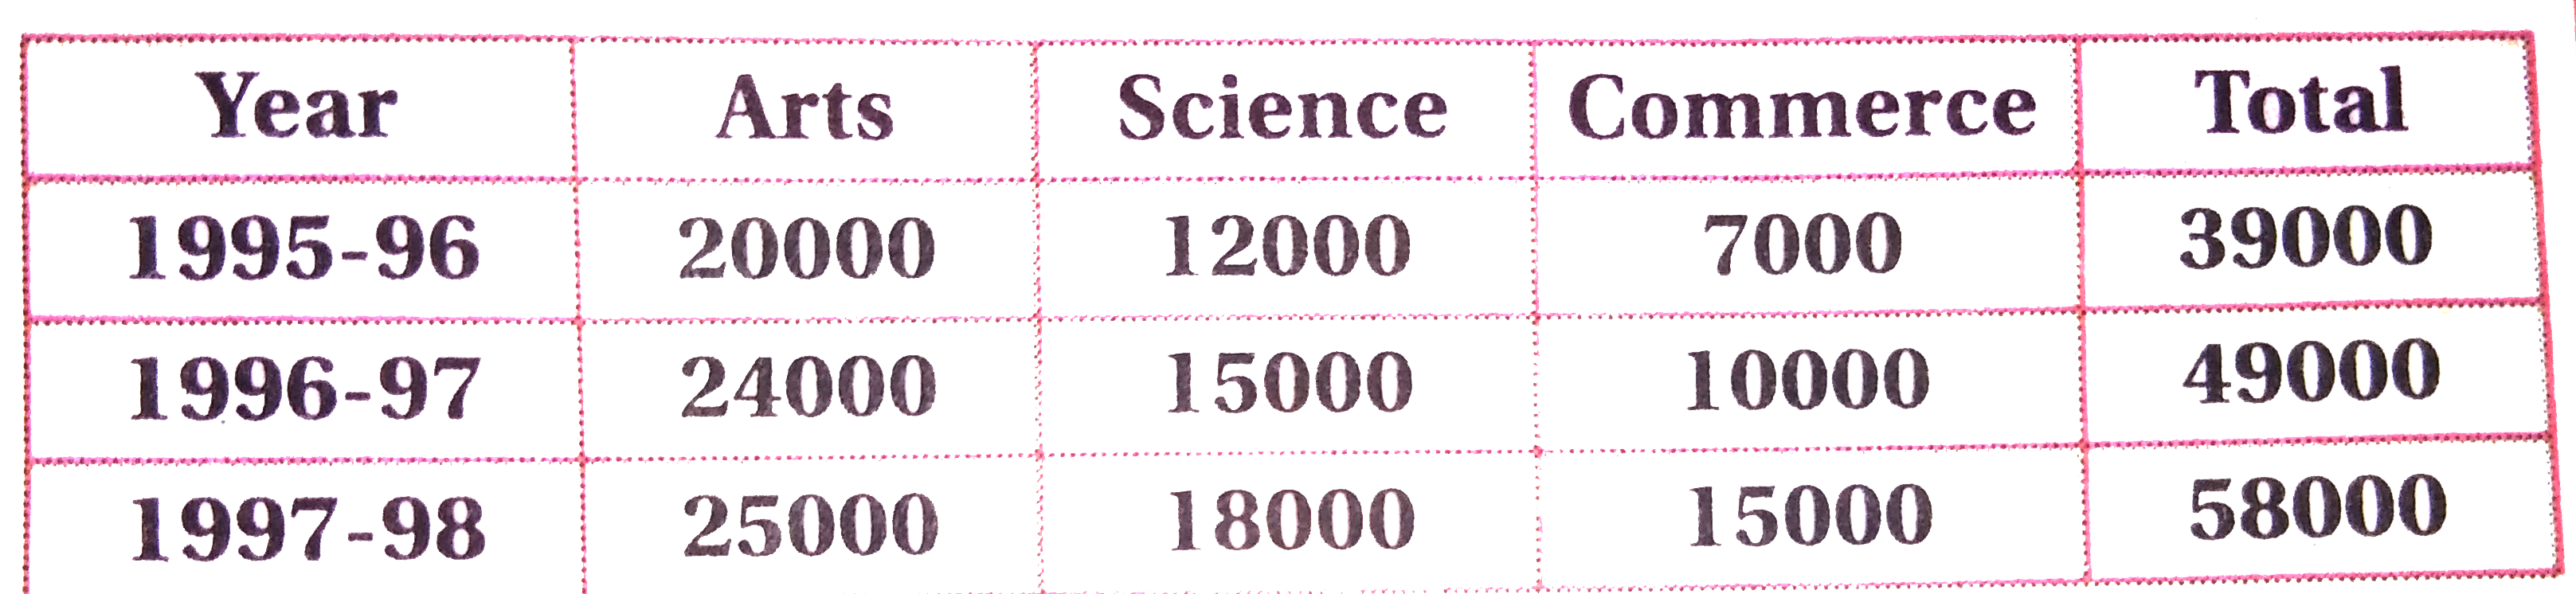
- The number of students in university during 1995-98 is given below: ...
Text Solution
|
- The following table gives the frequency distribution of heights in in...
Text Solution
|
- Draw a hsitpgram of the following frequency distribution:
Text Solution
|
- Frequency distribution of daily expenditure of 100 familes is given be...
Text Solution
|
- Draw a histrogram and frequency polygon of the following frequency dis...
Text Solution
|
- An urn contains 10 red and 8 white balls. One ball is drawn at random....
Text Solution
|
- Draw ogives (both ''less than'' and ''more than'') for the following d...
Text Solution
|
- Draw ogives of both types for the following distribution:
Text Solution
|