A
B
C
D
Text Solution
Verified by Experts
The correct Answer is:


Topper's Solved these Questions
STATES OF MATTER
A2Z|Exercise Dalton'S Law Of Partial Pressure, Graham'S Law Of Diffusion/ Effusion|37 VideosSTATES OF MATTER
A2Z|Exercise Kinectic Theory Of Gases, Maxwell Distribution Of Speed|45 VideosSTATES OF MATTER
A2Z|Exercise Section D - Chapter End Test|30 VideosSOME BASIC PRINCIPALS OF ORGANIC CHEMISTRY
A2Z|Exercise Section D - Chapter End Test|60 Videos
Similar Questions
Explore conceptually related problems
A2Z-STATES OF MATTER-Ideal Gas Equation
- A 0.5 dm^(3) flask contains gas A and 1 dm^(3) flask contains gas B at...
Text Solution
|
- In the equaiton PV= nRT, which one cannot be the numerical value of R
Text Solution
|
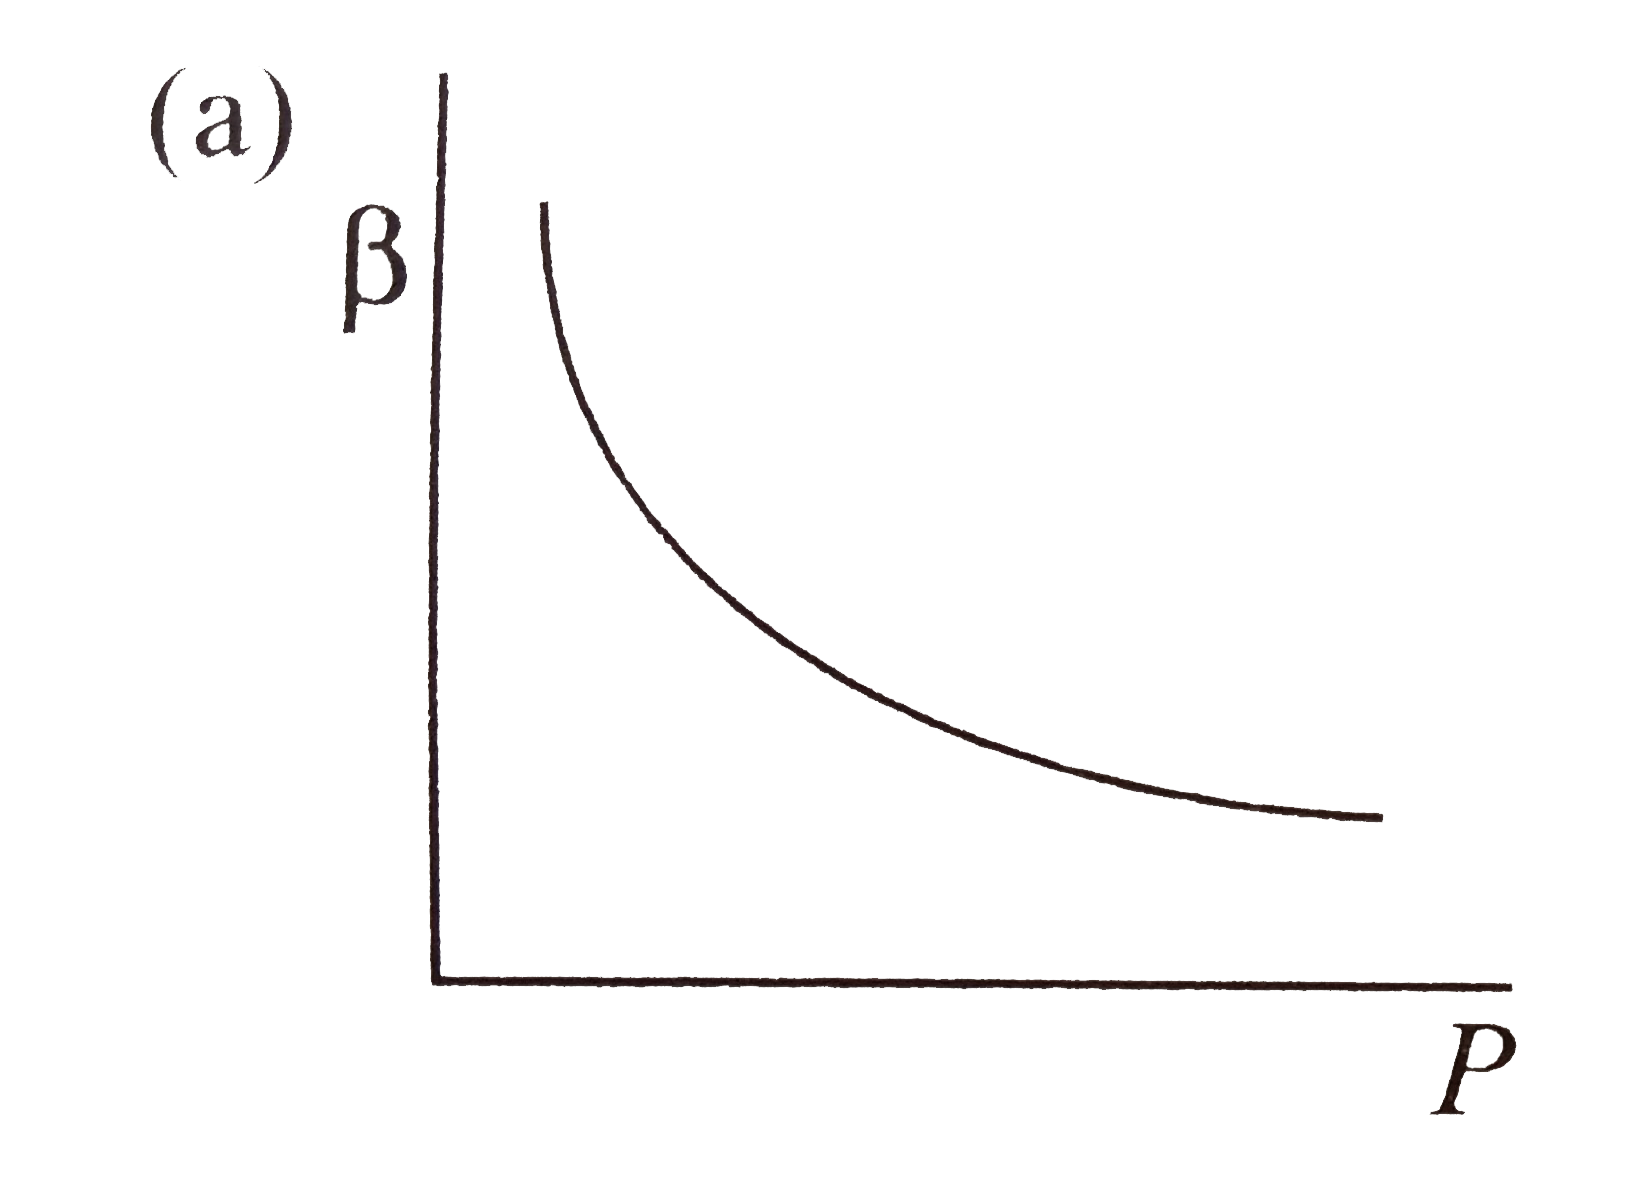
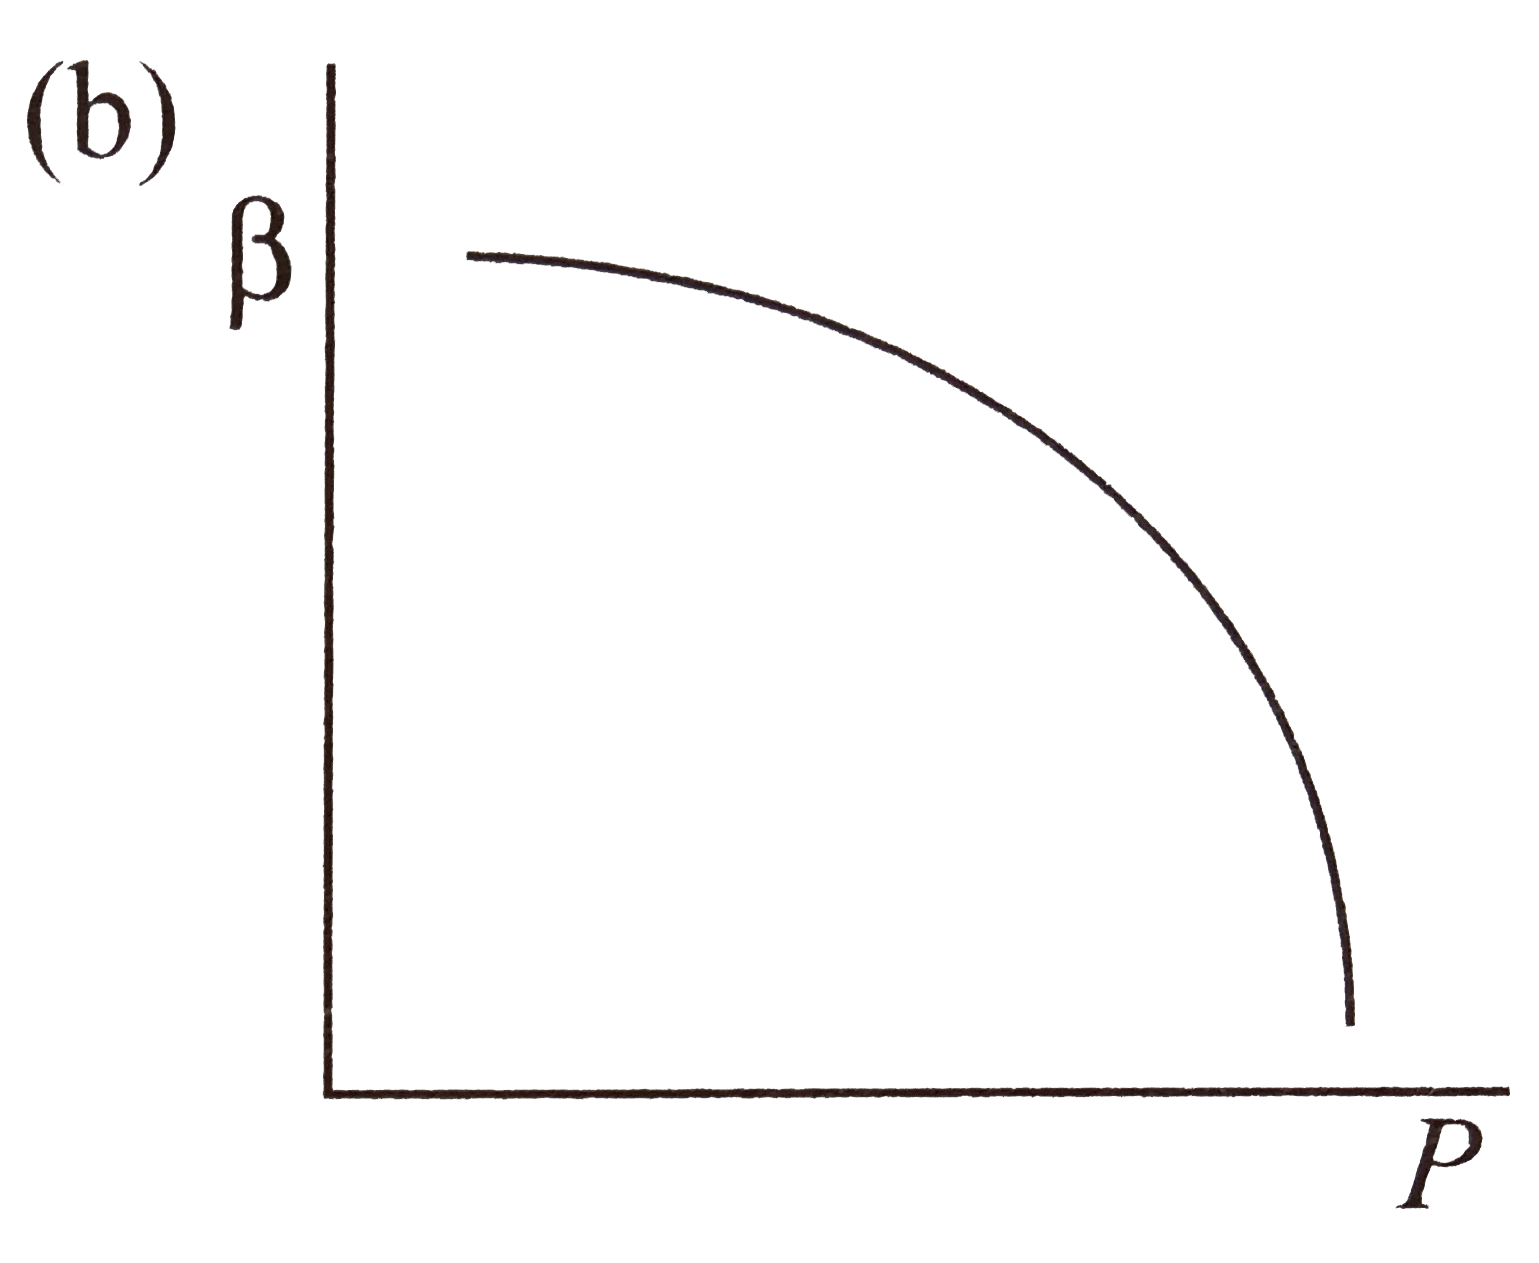
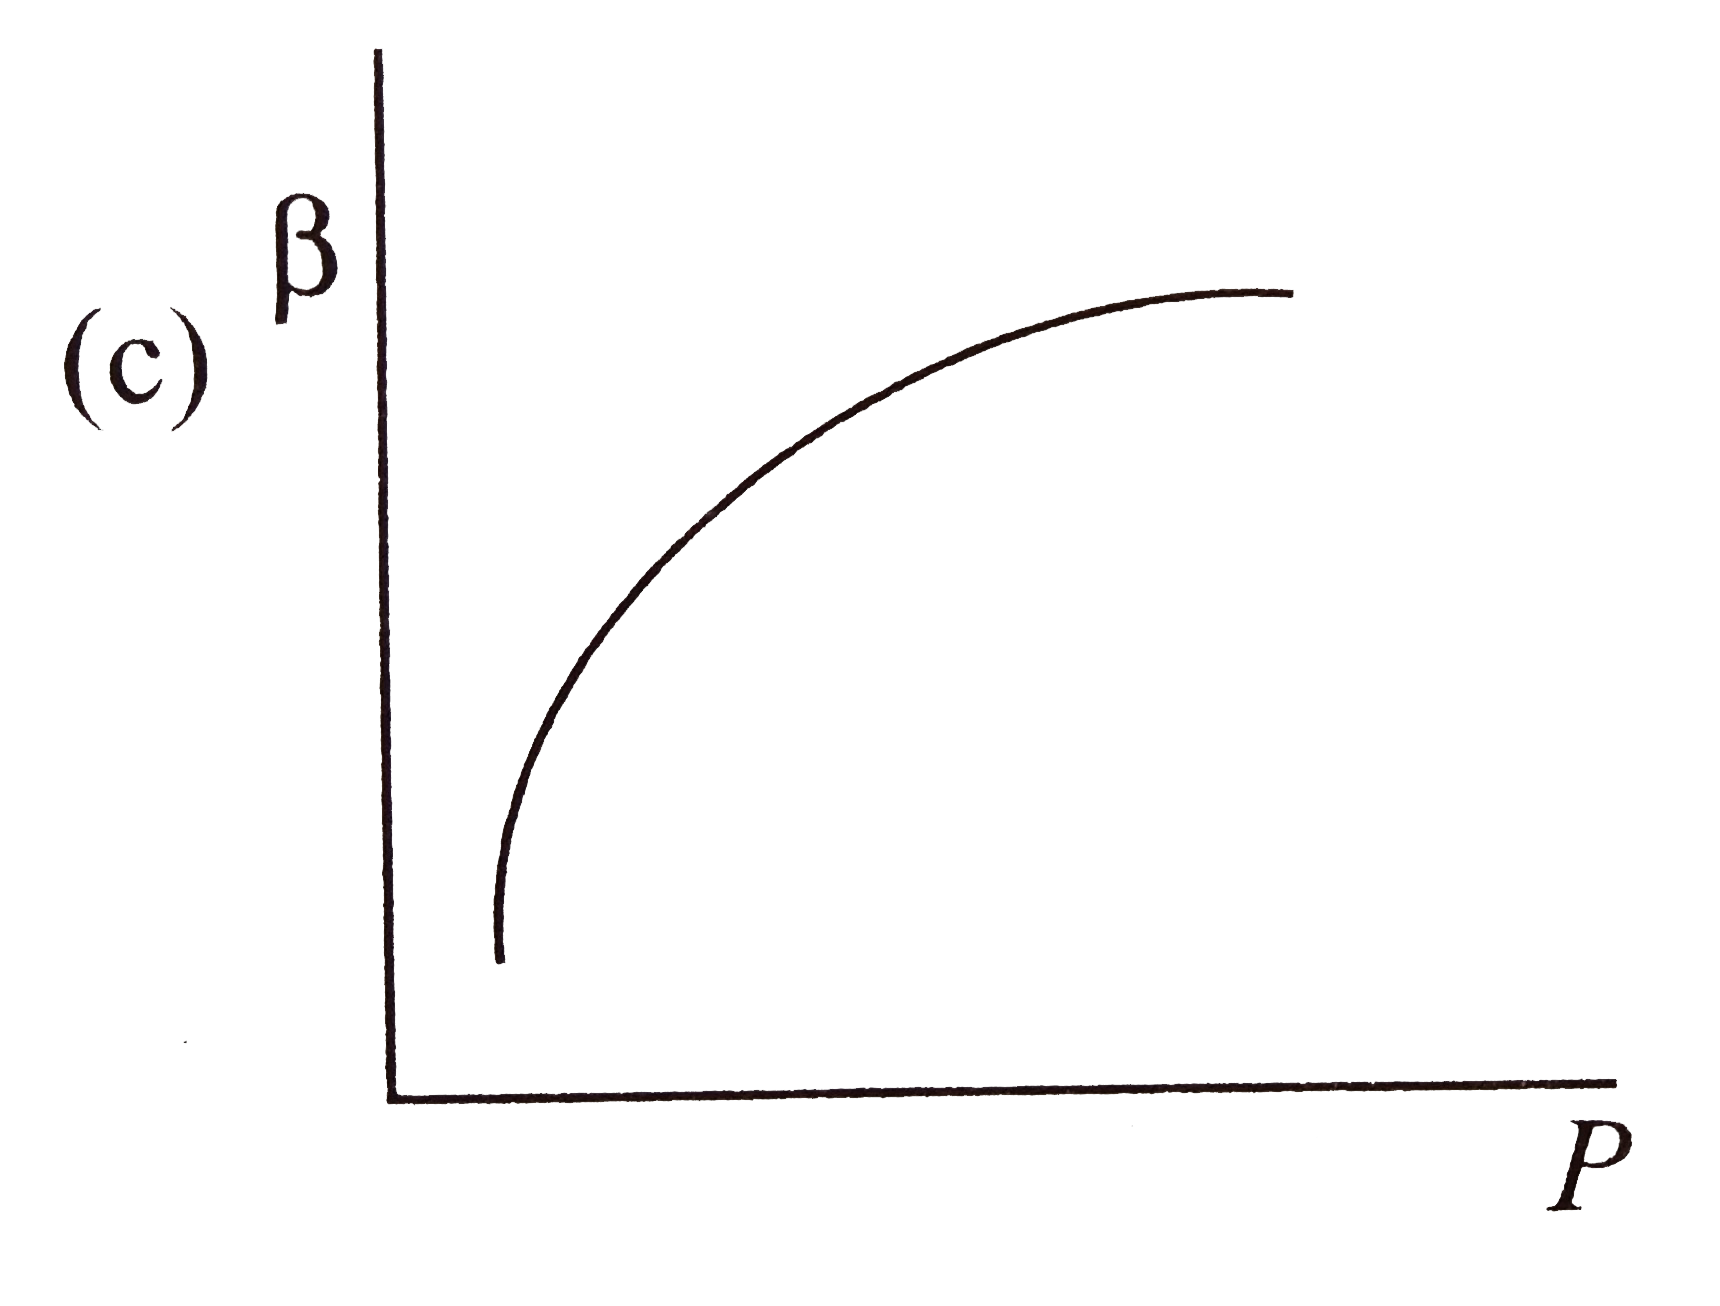
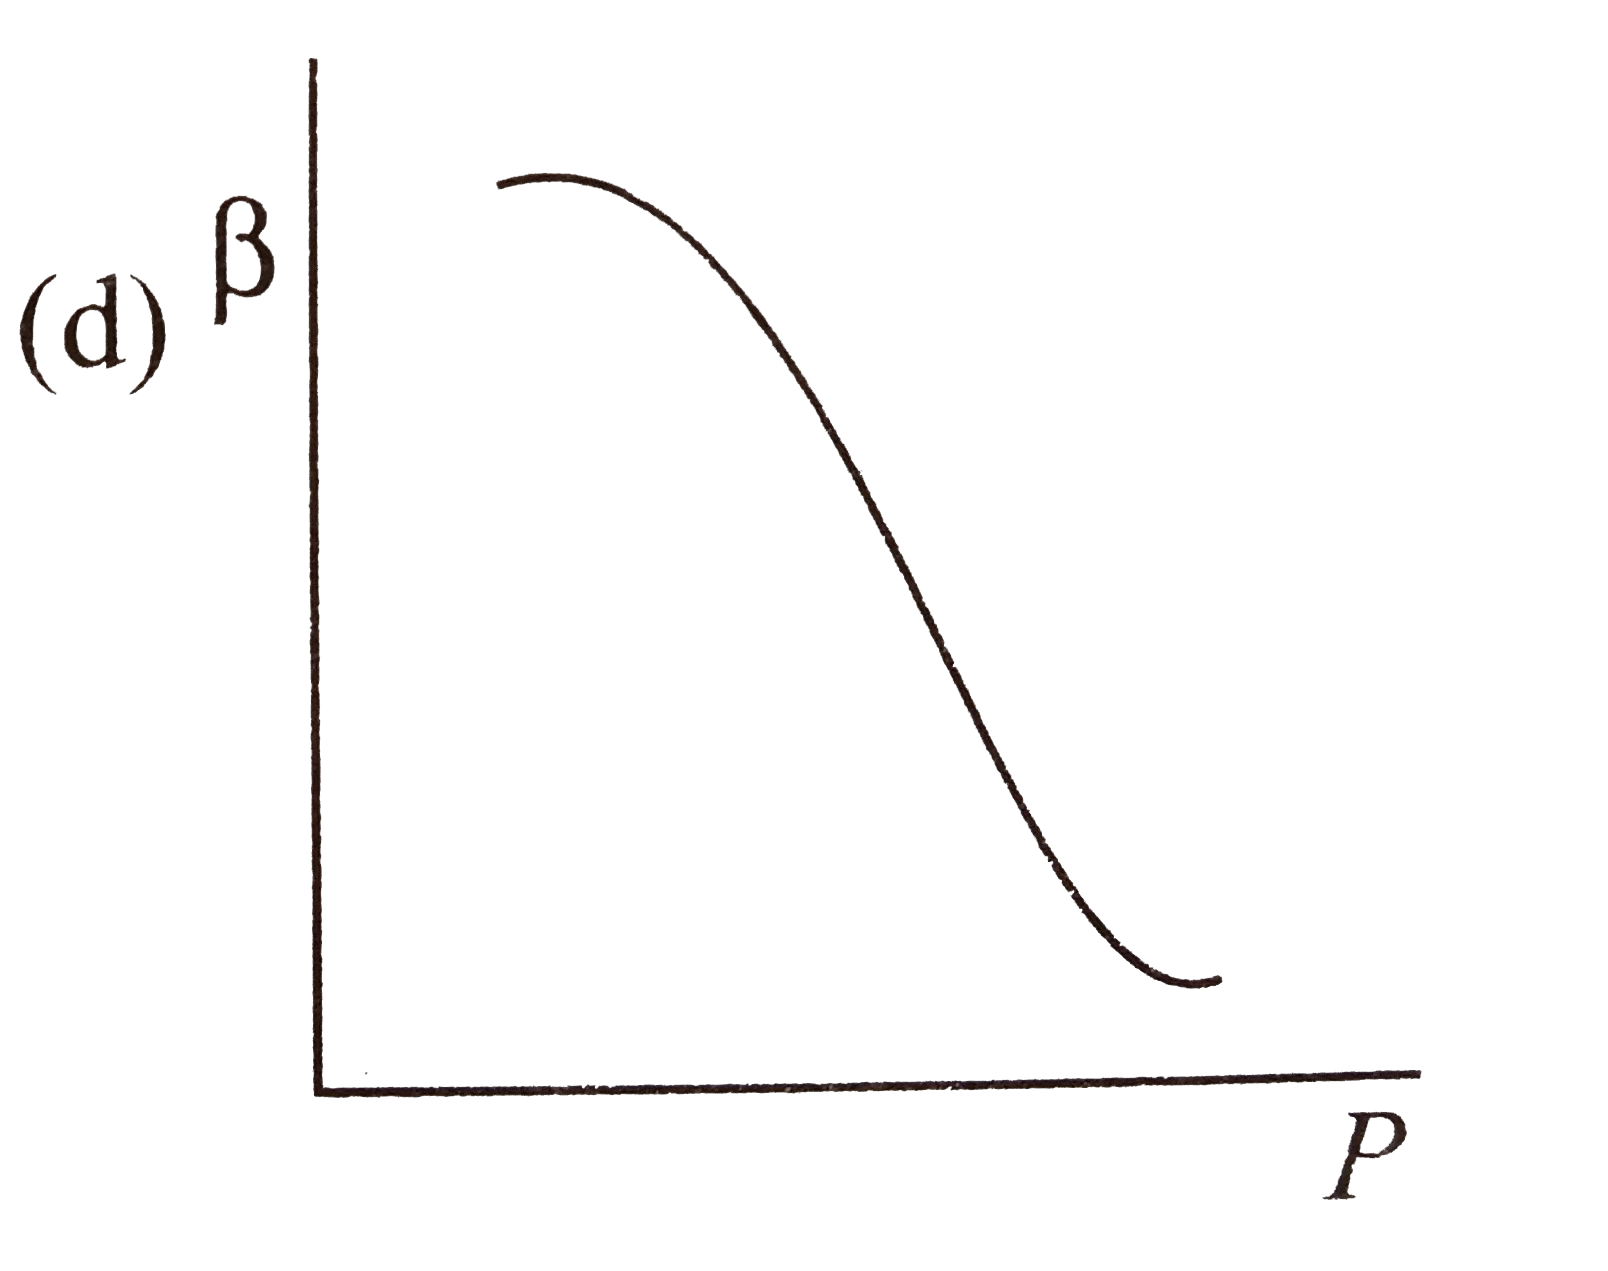
- Which of the following graphs correctly represents the variation of be...
Text Solution
|
- When 100 ml sample of methane and ethane along with excess of O(2) is ...
Text Solution
|
- Densities of two gases are in the ratio 1: 2 and their temperatures ar...
Text Solution
|
- Which of the following is/are incorrect regarding the universal gas co...
Text Solution
|
- Liquefied natural gas (LNG) is mainly methane. A 10 m^(3) tank is cons...
Text Solution
|
- Two separate bulbs contain ideal gas A and B. The density of a gas A i...
Text Solution
|
- If two mole of an ideal gas at 546 K occupies a volume of 44.8 litres,...
Text Solution
|
- The volume of a gas increased by a factor of 2 while the pressure decr...
Text Solution
|
- A closed vessel contains equal number of nitrogen and oxygen molecules...
Text Solution
|
- If 10 g of a gas at atmospheric pressue is cooled from 273^(@)C to 0^(...
Text Solution
|
- Under what conditions will a pure sample of an ideal gas not only exhi...
Text Solution
|
- A constant volume and temperature conditions, the rate of diffusion D(...
Text Solution
|
- What is the molecular weight of a gas whose density 40^(@)C and 785 mm...
Text Solution
|
- 120 g of an ideal gas of molecular weight 40 is confirmed to a volume ...
Text Solution
|
- Oxygen is present in a 1 L flask at a pressure of 7.6xx10^(-10)mm Hg. ...
Text Solution
|
- At a temperature T, K, the pressure of 4.0 gm argon in a bulb is P. Th...
Text Solution
|
- A hydrocarbon contains 10.5 g of carbon per gram of hydrogen. 1 L of v...
Text Solution
|
- A cylinder contains accetylene gas at 27^(@)C and 4.05M pa. The pressu...
Text Solution
|