A
B
C
D
Text Solution
Verified by Experts
The correct Answer is:


Topper's Solved these Questions
Similar Questions
Explore conceptually related problems
MARVEL PUBLICATION-FRICTIONAL IN SOLIDS AND LIQUIDS -TEST YOUR GRASP
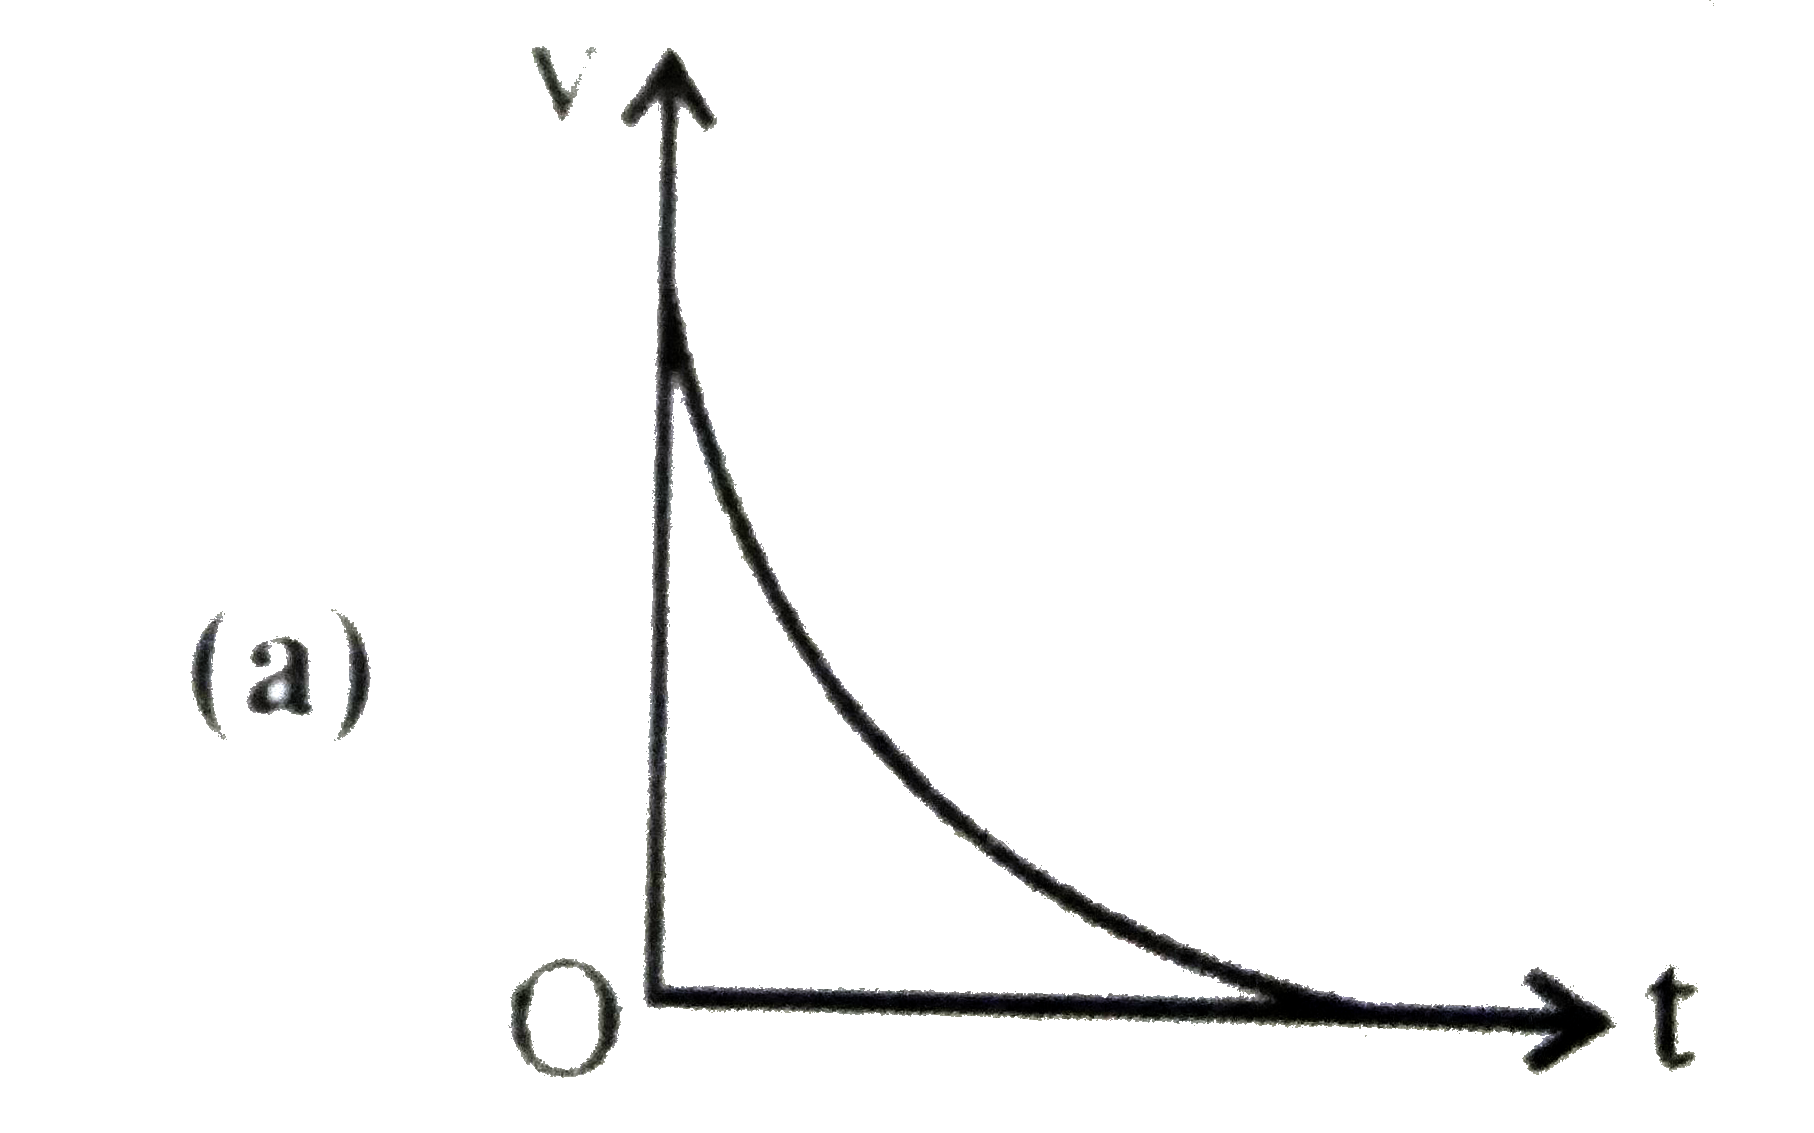
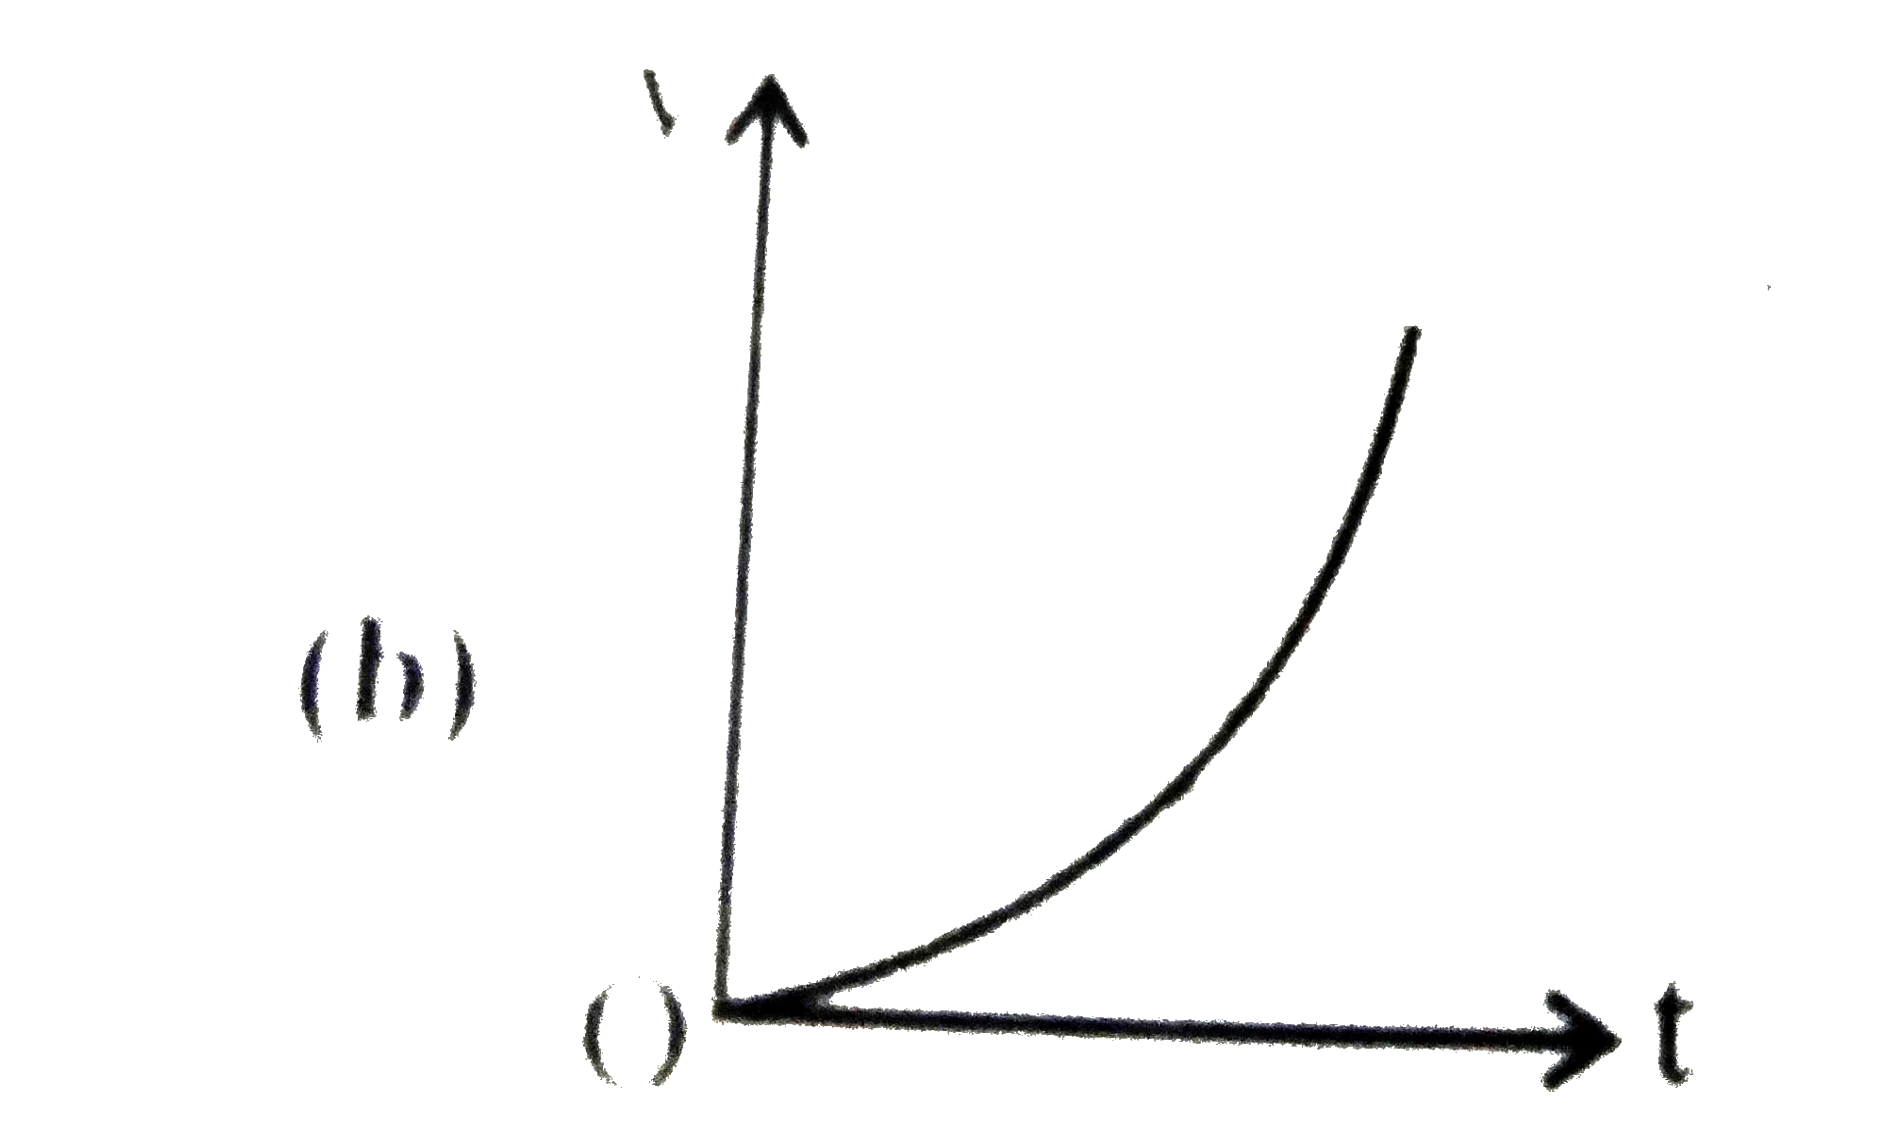
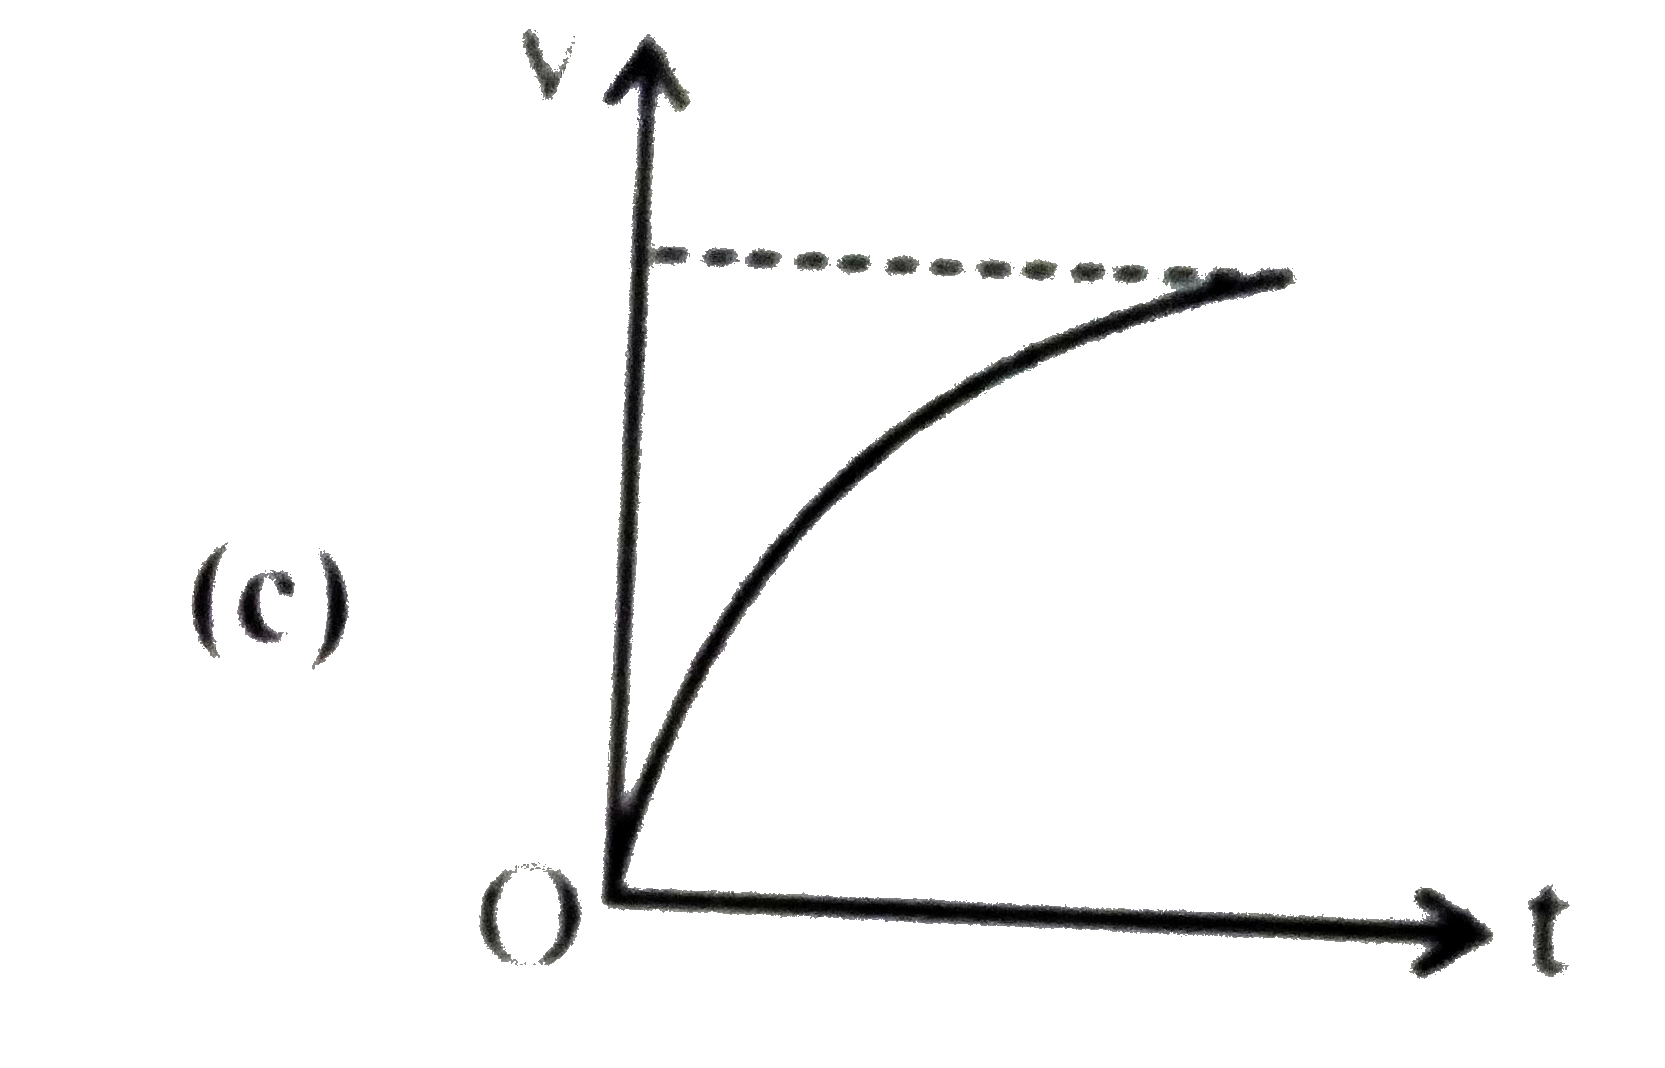
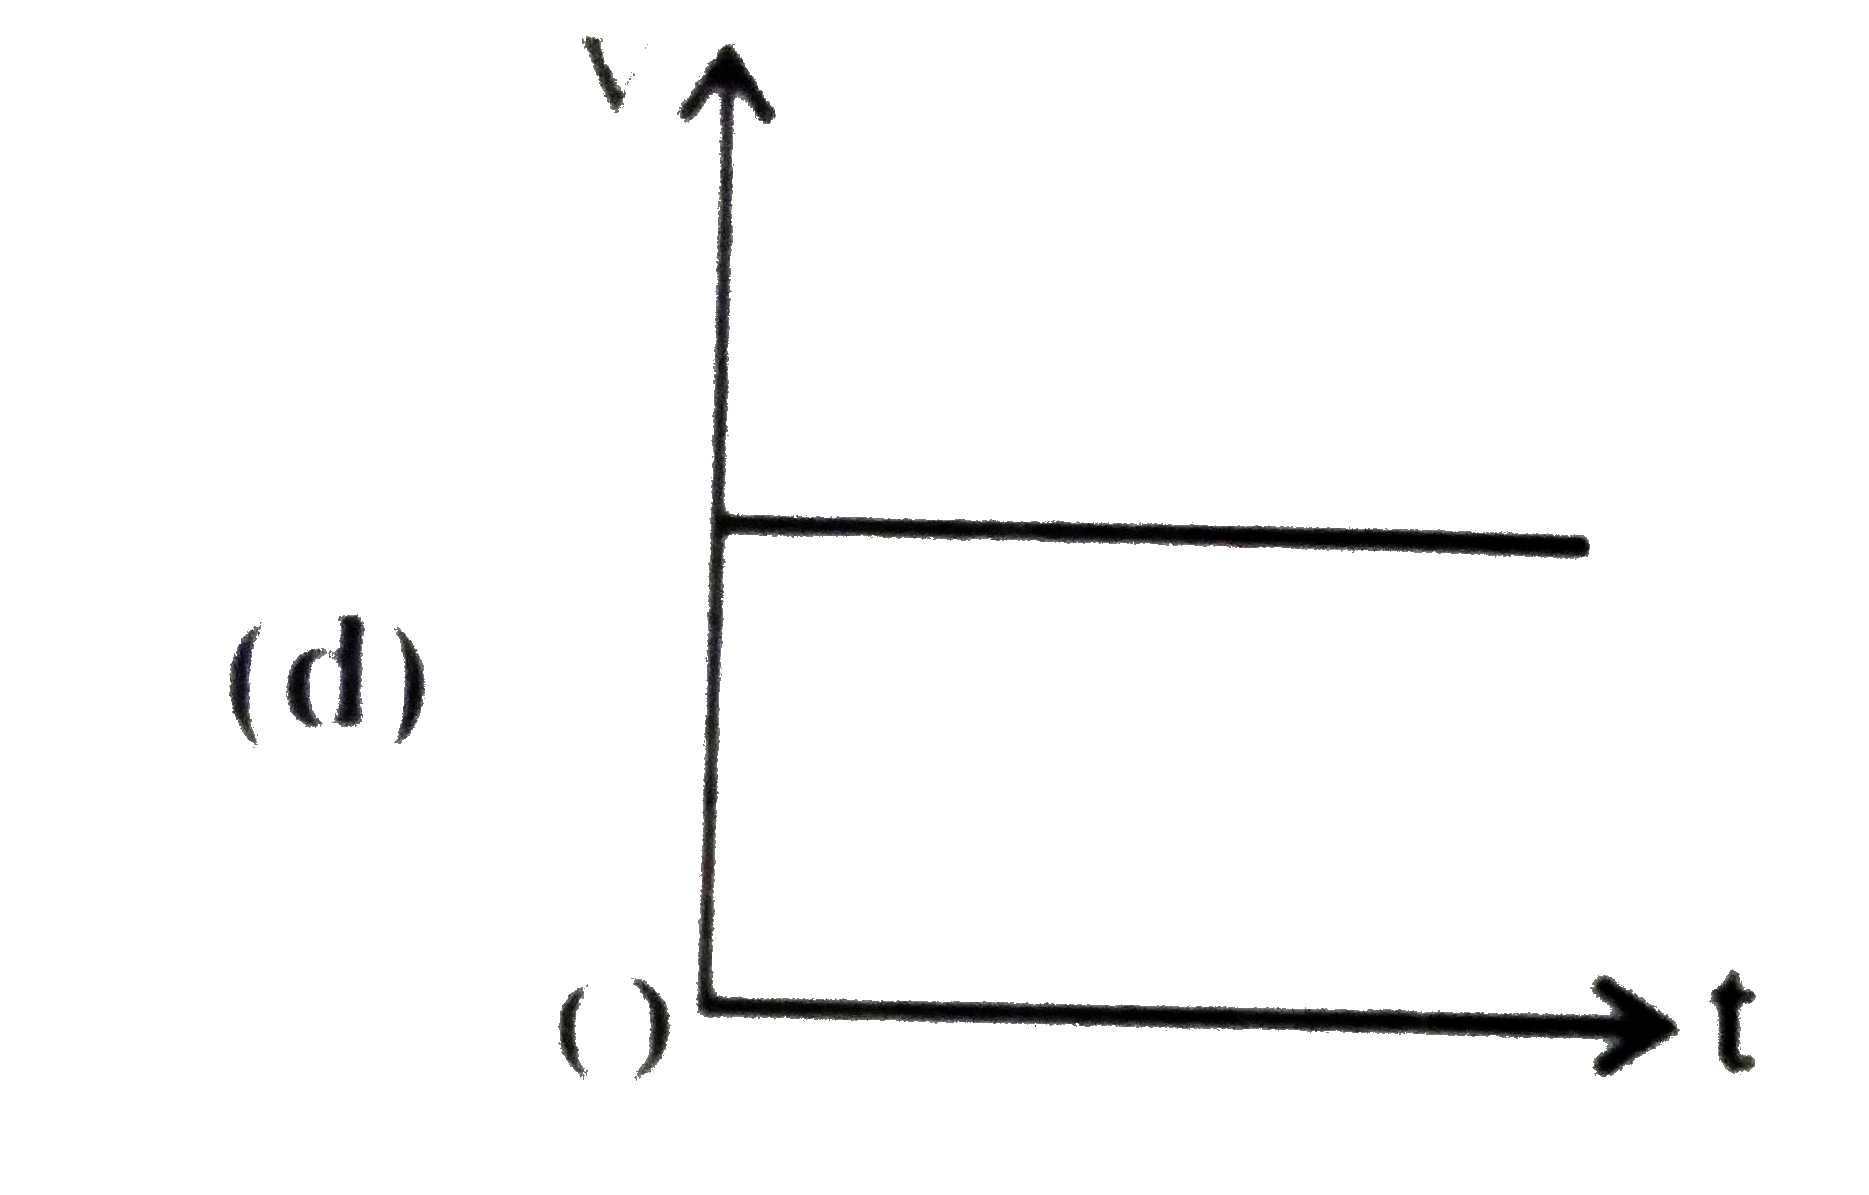
- In viscosity experiment which one is the graph between, velocity of ti...
Text Solution
|
- A wooden block of mass 100 Kg is kept on a horizontal platform. A forc...
Text Solution
|
- A horizontal force just sufficient to move a body of mass 4 kg lying ...
Text Solution
|
- A block weighing 10 kg just starts sliding down a rough inclined plane...
Text Solution
|
- A conical vessel having base area 4xx10^3 m^2 and height 40 cm is fill...
Text Solution
|
- A metal plate of area 20 cm^2, is separated from a large plate by a la...
Text Solution
|
- Eight equal droplets of water each ofradius rare falling through air w...
Text Solution
|
- The water level on a tank is 5m high. There is a hole of 1 cm^(2) cro...
Text Solution
|
- The flow speeds of air on the lower and upper surfaces of the wing ofa...
Text Solution
|
- At two points on a horizontal tube of varying cross-section, the radii...
Text Solution
|
- If the pressure at half the depth of a tank is equal to 2/3 the pressu...
Text Solution
|