A
B
C
D
Text Solution
Verified by Experts
The correct Answer is:


Topper's Solved these Questions
STATES OF MATTER
R SHARMA|Exercise Follow -up Test 4|6 VideosSTATES OF MATTER
R SHARMA|Exercise Follow -up Test 5|8 VideosSTATES OF MATTER
R SHARMA|Exercise Follow -up Test 2|14 VideosSOME BASIC CONCEPTS OF CHEMISTRY
R SHARMA|Exercise Archives|26 VideosSTRUCTURE OF ATOM
R SHARMA|Exercise ARCHIVES|55 Videos
Similar Questions
Explore conceptually related problems
R SHARMA-STATES OF MATTER-Follow -up Test 3
- On the basis of his experiments, Robert Boyle reached the conclusion t...
Text Solution
|
- Mathematically, Boyle's law can be written as (constant n,T) (i) p p...
Text Solution
|
- Boyle showed that for a given sample of gas at a constant temperature,...
Text Solution
|
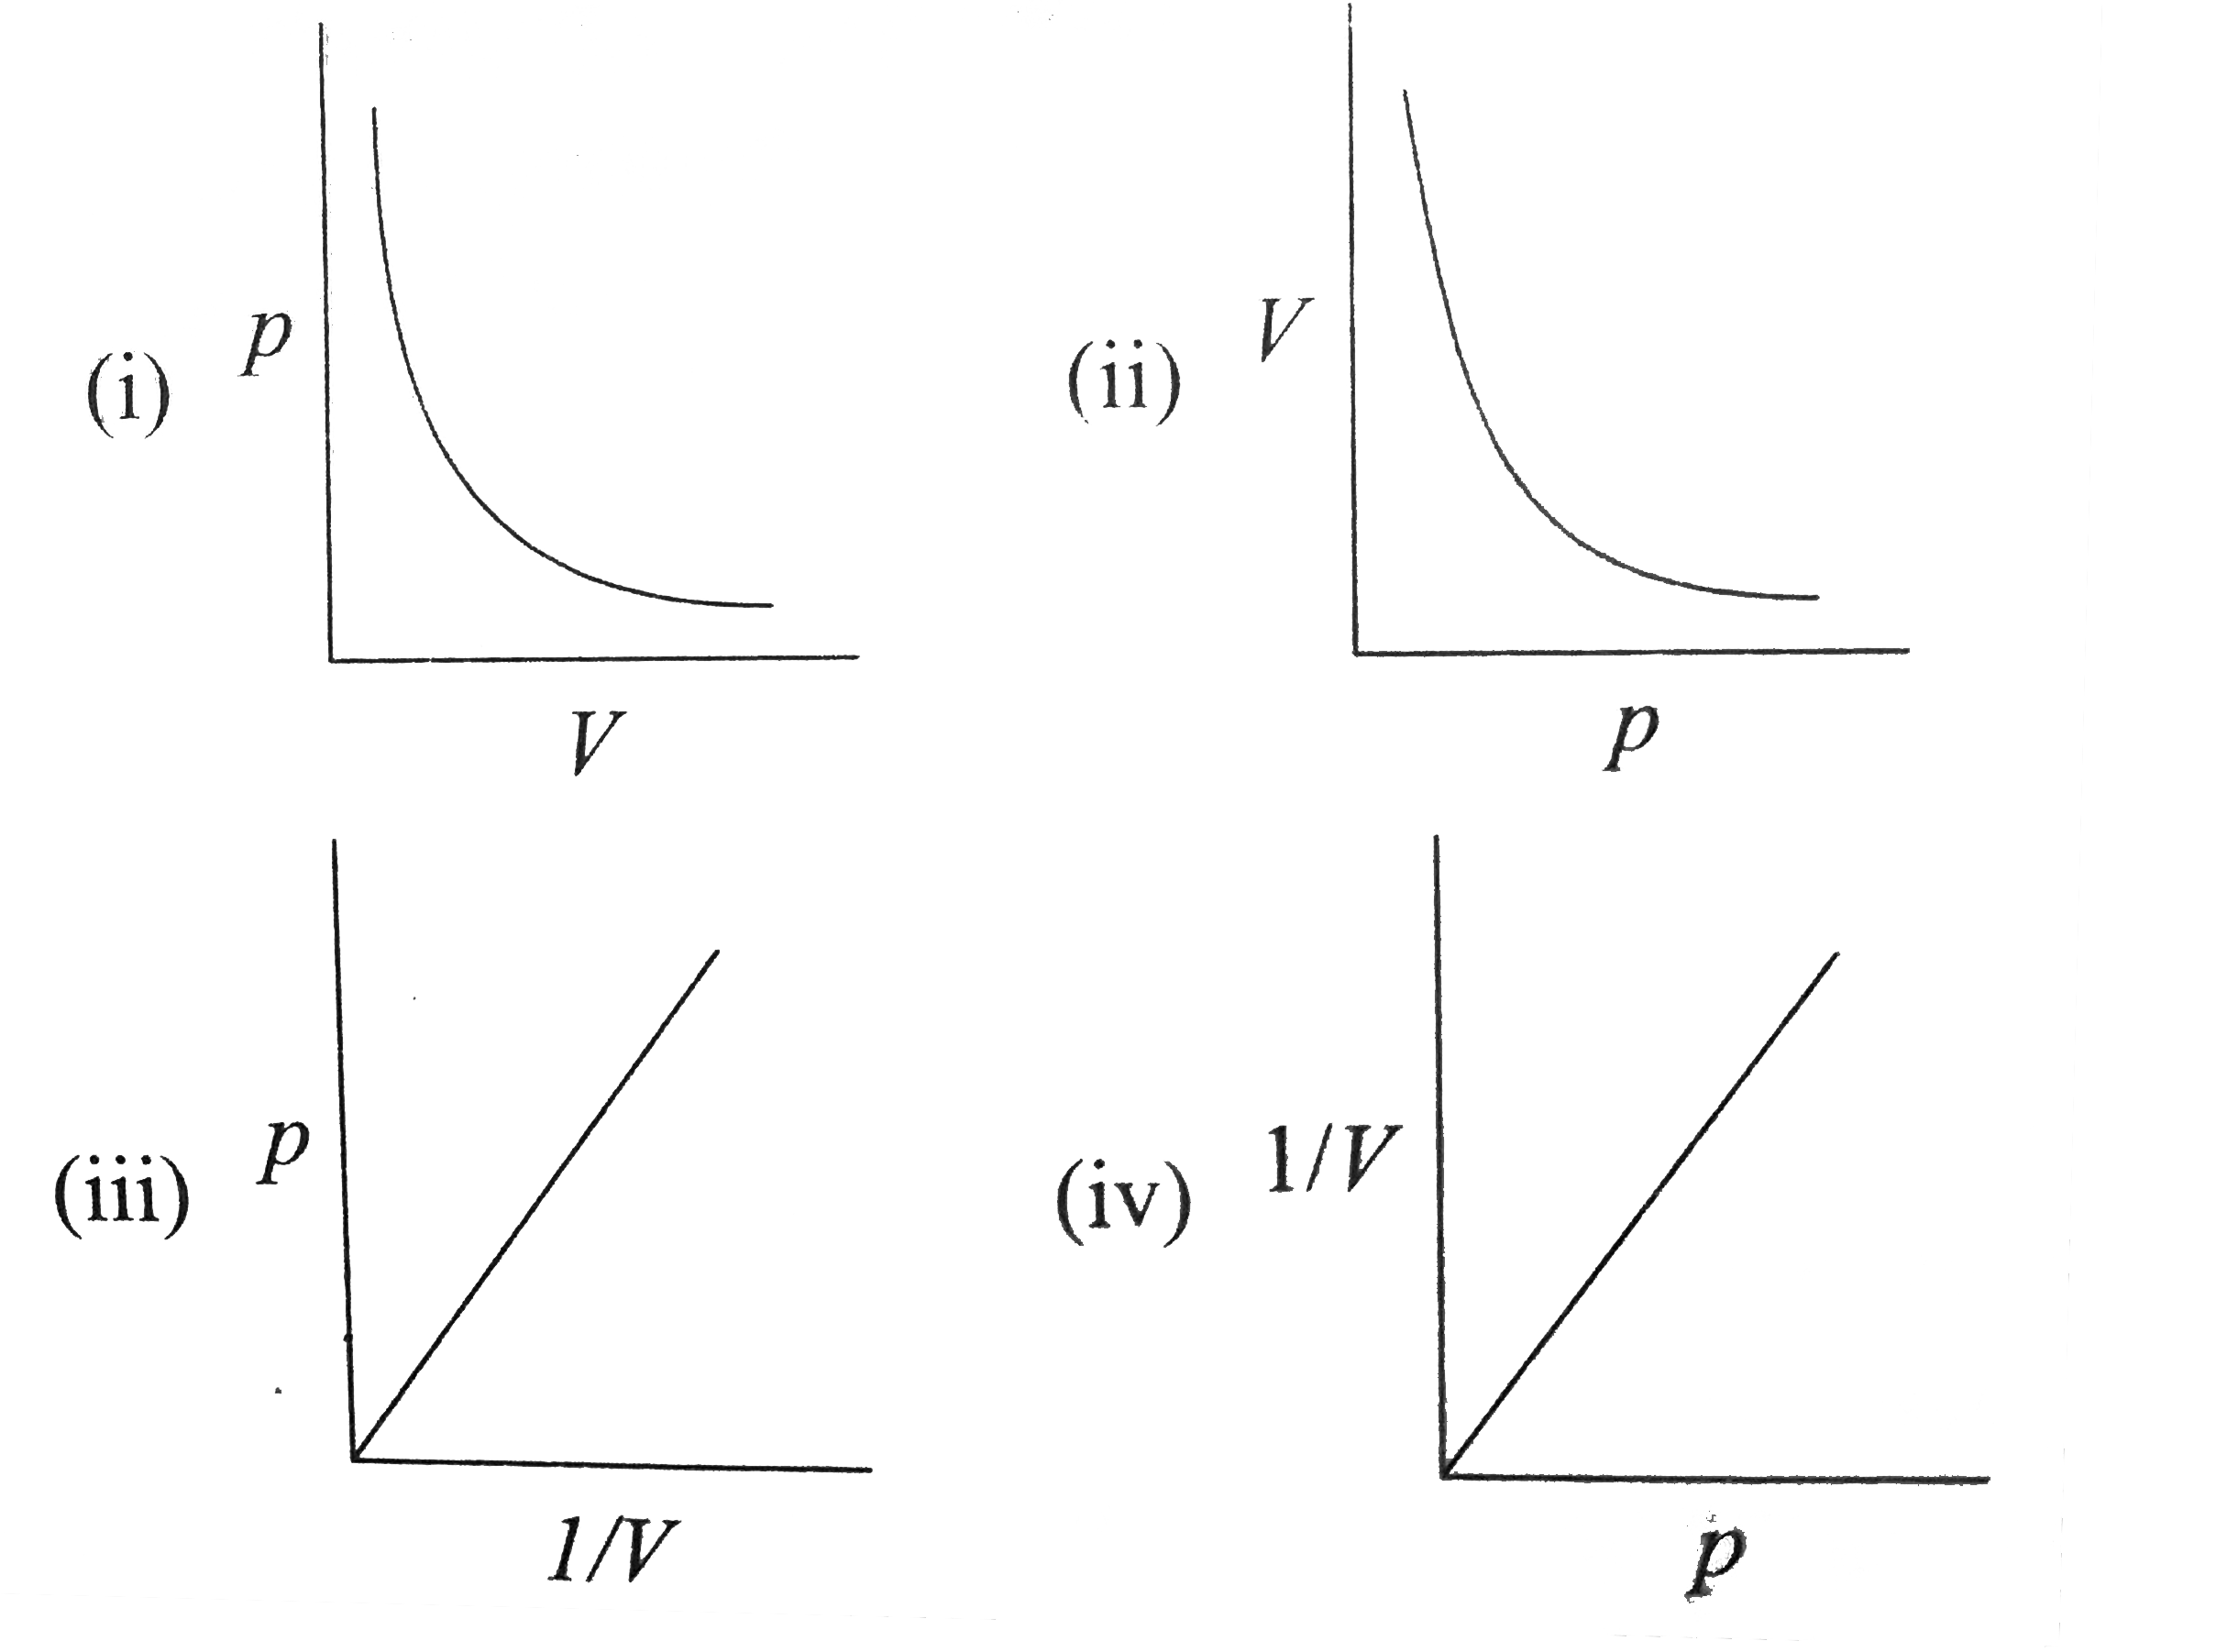
- Which of the following graphs represents Boyle's law correctly? (i)
Text Solution
|
- Which of the following plots does not represent Boyle's law?
Text Solution
|
- In Boyle's law calculations, the pressure of the gas or applied pressu...
Text Solution
|
- A sample of gas at room temperature is placed in an evacuated bulb of...
Text Solution
|