A
B
C
D
Text Solution
Verified by Experts
The correct Answer is:


Topper's Solved these Questions
STATES OF MATTER
R SHARMA|Exercise Follow -up Test 8|14 VideosSTATES OF MATTER
R SHARMA|Exercise Follow -up Test 9|8 VideosSTATES OF MATTER
R SHARMA|Exercise Follow -up Test 6|13 VideosSOME BASIC CONCEPTS OF CHEMISTRY
R SHARMA|Exercise Archives|26 VideosSTRUCTURE OF ATOM
R SHARMA|Exercise ARCHIVES|55 Videos
Similar Questions
Explore conceptually related problems
R SHARMA-STATES OF MATTER-Follow -up Test 7
- Which of the following is not a correct postulate of the kinetic molec...
Text Solution
|
- The average speed of gas molecules is equal to
Text Solution
|
- The distribution of speeds of molecules of a gas depends on (i) temp...
Text Solution
|
- Three gases CO(2) ,O(2) , and Cl(2) are at the same temperature. Whic...
Text Solution
|
- According to the kinetic theory of gases, the pressure exerted by the ...
Text Solution
|
- Which of the following relationships is valid for the root mean square...
Text Solution
|
- The root mean square velocity of an ideal gas to constant pressure var...
Text Solution
|
- At constant volume, for a fixed number of moles of a gas, the pressure...
Text Solution
|
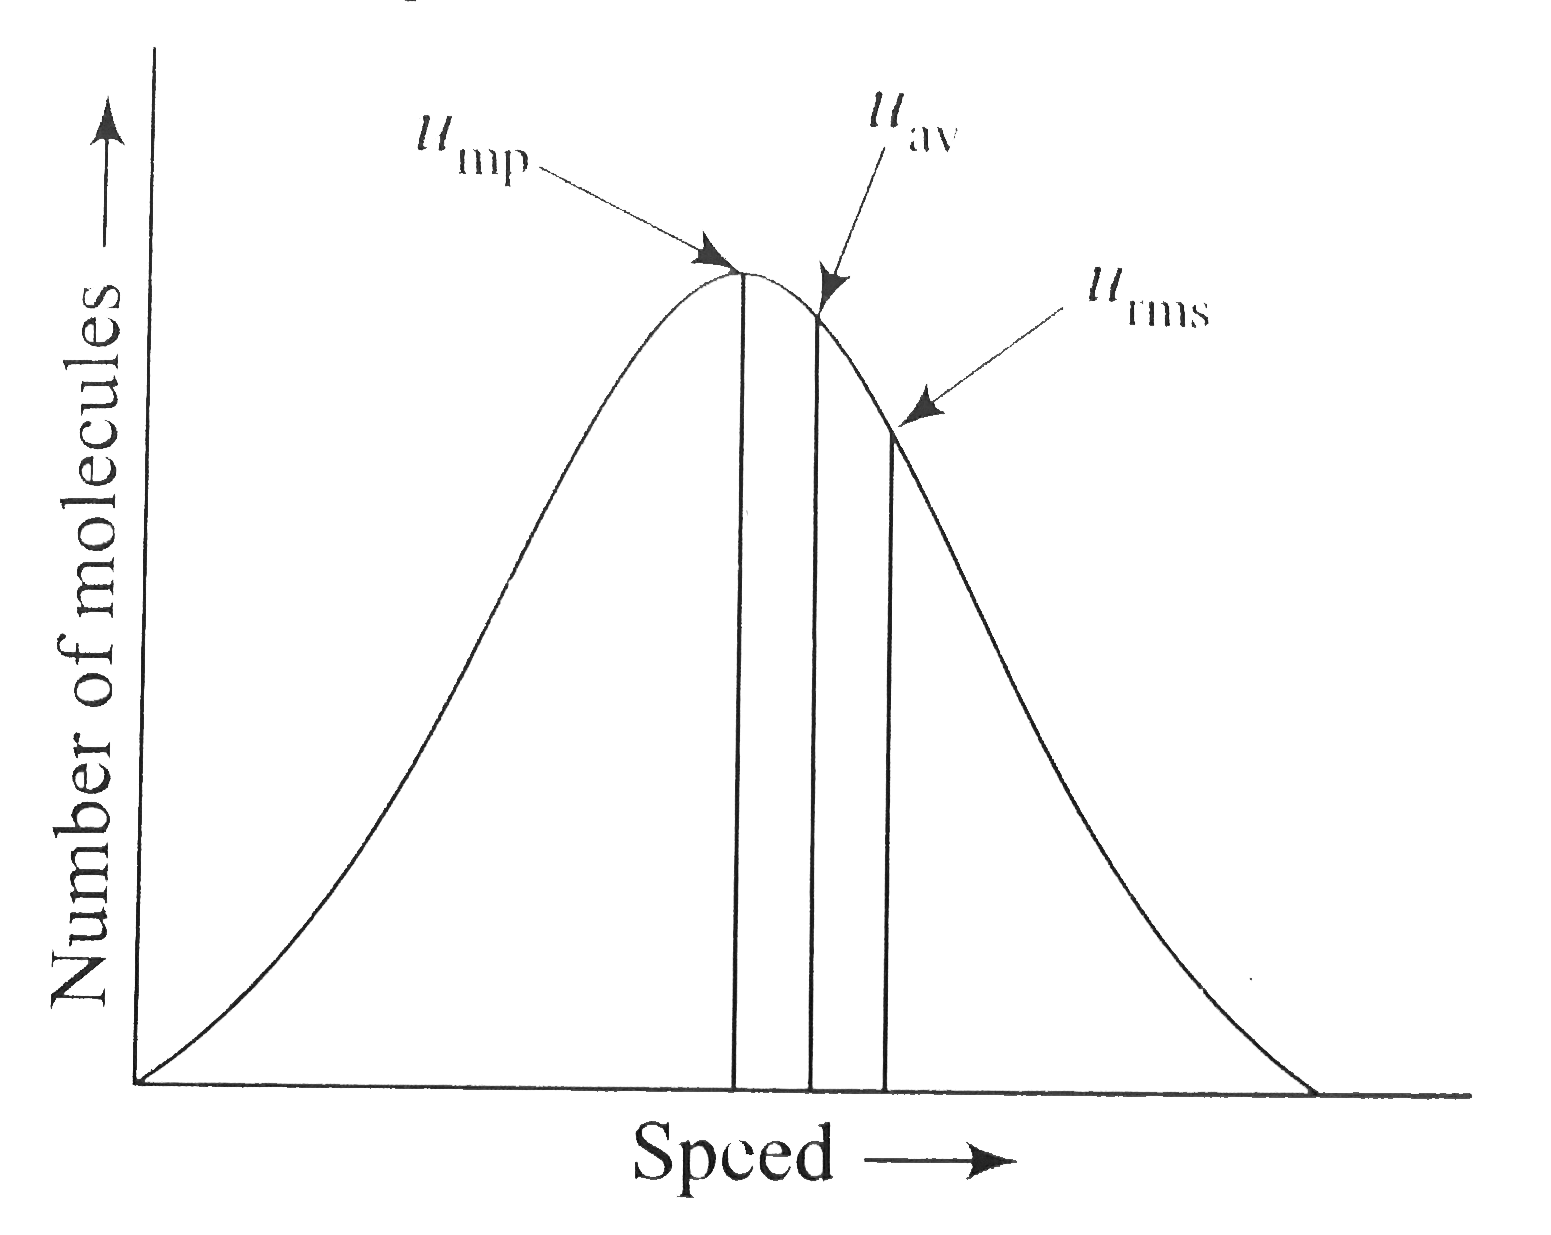
- The ratio between the three speeds, u(mp) : u(av) : u(rms) is given a...
Text Solution
|
- Which of the following is used in deriving the kinetic gas equation ?
Text Solution
|
- Which of the following relationships is valid ? where K is a proport...
Text Solution
|
- For an ideal gas, pressure (p) and interal energy (E ) per unit volume...
Text Solution
|
- The maximum in the curves describing the Maxwell-Boltzmann distributio...
Text Solution
|