Home
Class 12
PHYSICS
Suppose electric potential varies along ...

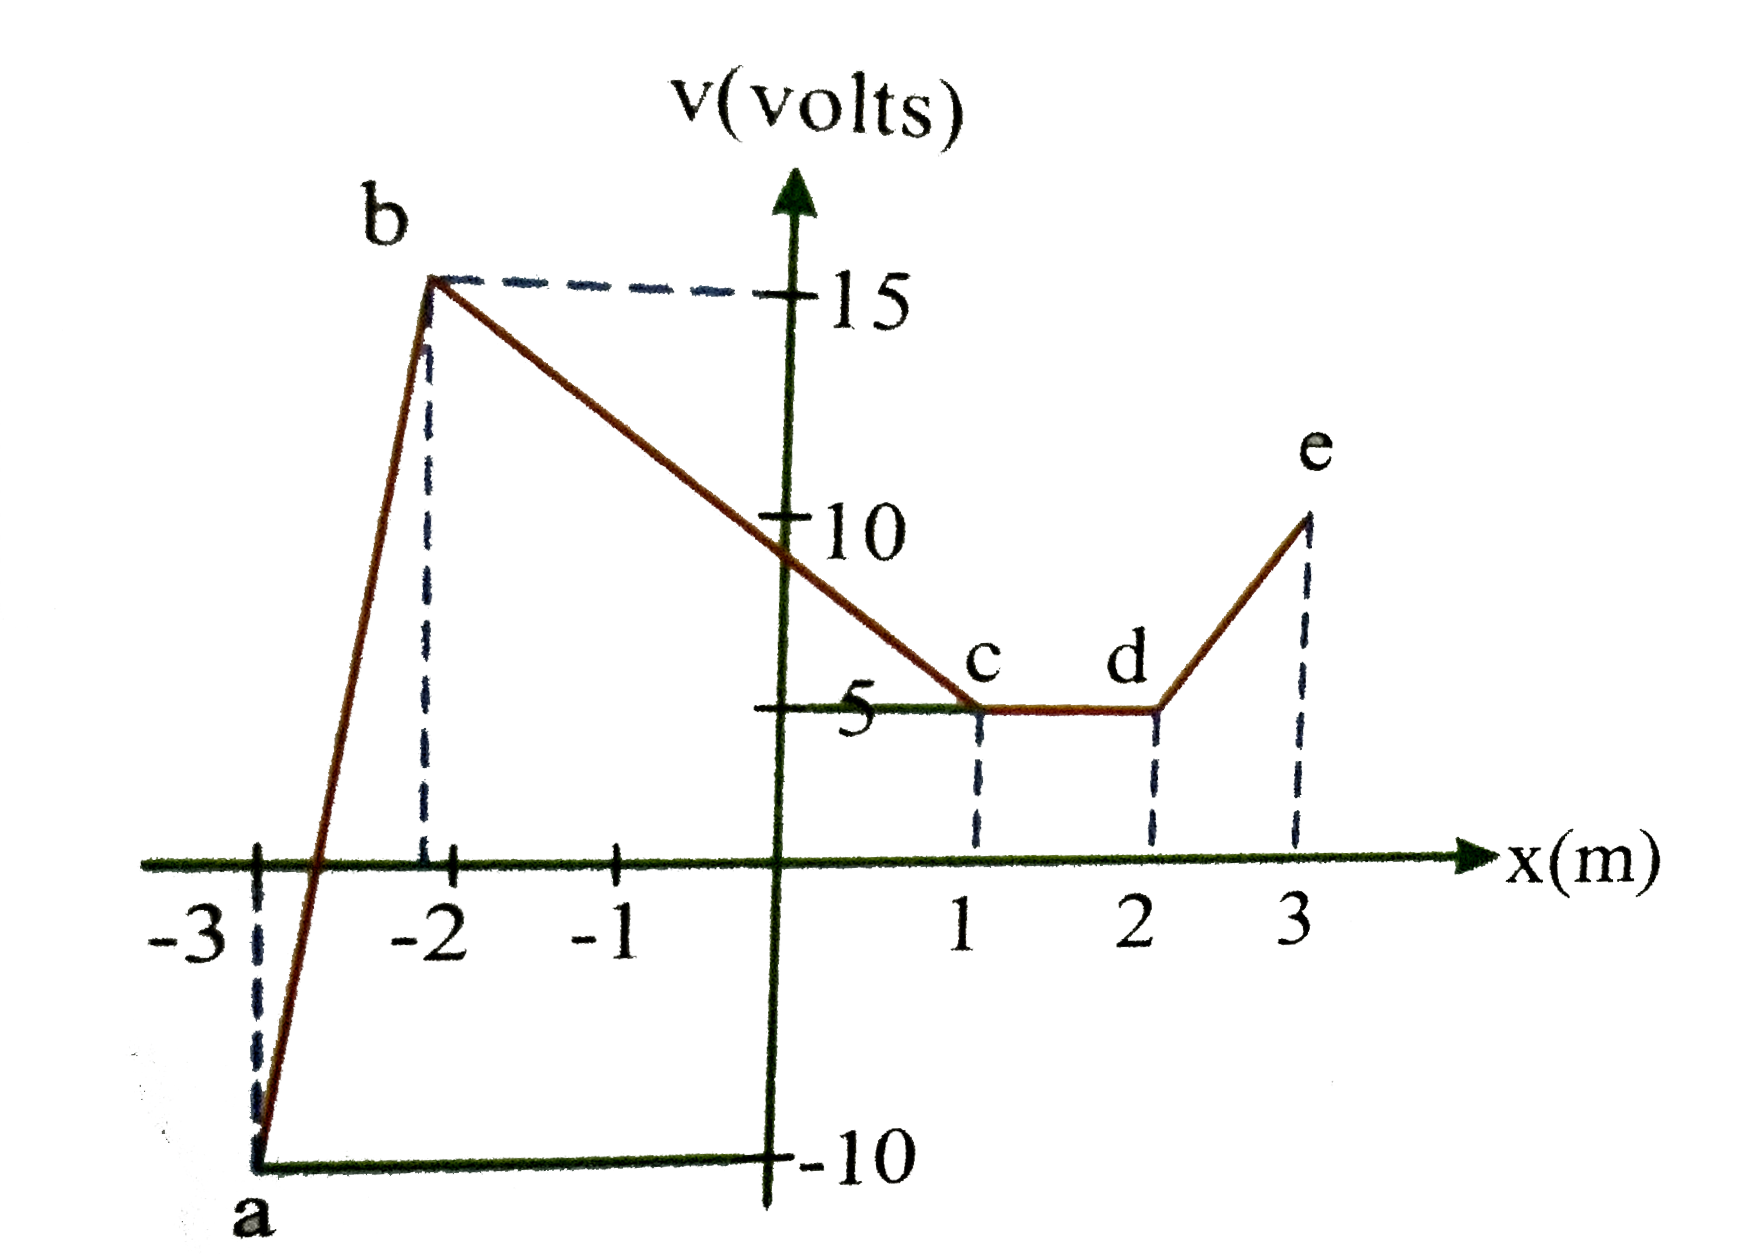
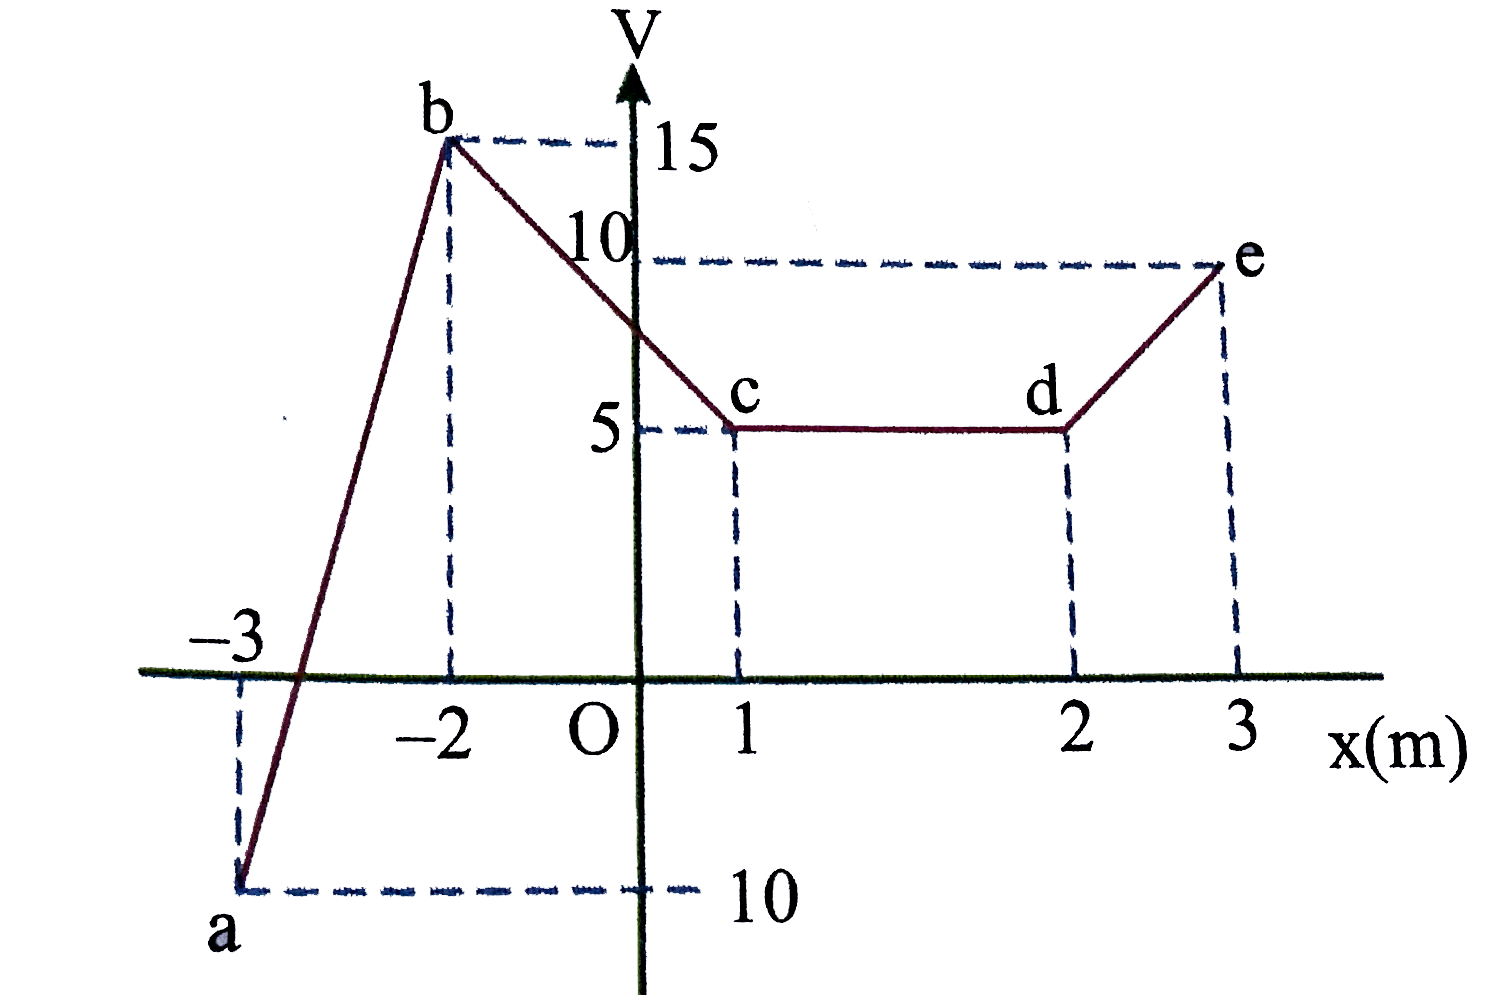
Suppose electric potential varies along the `x-axis` as shown in the above figure the potential doesnot vary in `y or z` direction of the intervals shown (ignore the behaviour at the end points of the intervals) the field `E_(x)` has a maximum absolute value `"FB_(1)"Vm^(-1)` in the region `"FB_(2)"` its value in the region cd is `"FB_(3)"Vm^(-1)` then
The region that fills `"FB_(2)"` is

A

`ab`

B

`de`

C

`bc`

D

`dc`

Text Solution

Verified by Experts

The correct Answer is:
A


`(E_(x))_(max)`Value `'FB_(1)'` in the region `FB_(2)`
`E_(x)`=value of `cd`is `FB_(3)Vm^(-1)`
`E=-(dV)/(dx)rArr E_(ab)=-((25)/(1))=-25`
`E_(be)=((5-15)/(1+2))=(10)/(3)E_(cd)=0`
`E_(de)=-((15-5)/(3-2))=-10`
`rArr (E_(x))_(Max)=25V//m^(-1)rArr FB_(2)` is `ab`
Taking the values of `E_(ab),E_(bc),E_(cd),E_(de),` .The plot of `E_(x)` Vsx will be as shown in `D` option.
For `a rarr b` part `V =25x+65`
`:.` when `V=0rArr x=(-65)/(25)=(-13)/(5)m`
Promotional Banner

Topper's Solved these Questions

  • ELECTROSTATICS AND GAUSS LAW

    NARAYNA|Exercise Passage V|3 Videos
  • ELECTROSTATICS AND GAUSS LAW

    NARAYNA|Exercise Passage VI|3 Videos
  • ELECTROSTATICS AND GAUSS LAW

    NARAYNA|Exercise Passage III|3 Videos
  • ELECTROSTATIC POTENTIAL AND CAPACITANCE

    NARAYNA|Exercise ADDITIONAL PROBLEMS|14 Videos
  • EXPERIMENTAL PHYSICS

    NARAYNA|Exercise Comprehension type|6 Videos

Similar Questions

Explore conceptually related problems

Suppose electric potential varies along the x-axis as shown in the above figure the potential doesnot vary in y or z direction of the intervals shown (ignore the behaviour at the end points of the intervals) the field E_(x) has a maximum absolute value "FB_(1)"Vm^(-1) in the region "FB_(2)" its value in the region cd is "FB_(3)"Vm^(-1) then The plot E_(x)vsx is

Suppose electric potential varies along the x-axis as shown in the above figure the potential doesnot vary in y or z direction of the intervals shown (ignore the behaviour at the end points of the intervals) the field E_(x) has a maximum absolute value "FB_(1)"Vm^(-1) in the region "FB_(2)" its value in the region cd is "FB_(3)"Vm^(-1) then The value that fills "FB_(1)" is

Suppose electric potential varies along the x-axis as shown in the above figure the potential doesnot vary in y or z direction of the intervals shown (ignore the behaviour at the end points of the intervals) the field E_(x) has a maximum absolute value "FB_(1) Vm^(-1) in the region "FB_(2)" its value in the region cd is "FB_(3)"Vm^(-1) then The value that fills "FB_(3)" is

Suppose electric potential varies along the x-axis as shown in the above figure the potential doesnot vary in y or z direction of the intervals shown (ignore the behaviour at the end points of the intervals) the field E_(x) has a maximum absolute value "FB_(1)"Vm^(-1) in the region "FB_(2)" its value in the region cd is "FB_(3)"Vm^(-1) then In the V vs x curve ,the potential possesses a zero value at

In an electric field region, the electric potential varies along the x-axis as shown in the graph. The x components of the electirc field in the regions for the intervals PQ and QR as market in the garph, in N//C , are respectively:

Use a definite integral to find the area of the region between the given curve and the x-axis on the interval [0, b] y = x/2+1

The variation of electric potential with distance from a fixed point is shown in figure. What is the value of electric field at x = 2m -

The electric potential in a region is represented as V=2x+3y-z obtain expression for electric field strength.

The electric potential at any point x,y an z in metres is given by V = 3x^(2) . The electric field at a point (2,0,1) is