 .
.A
B
C
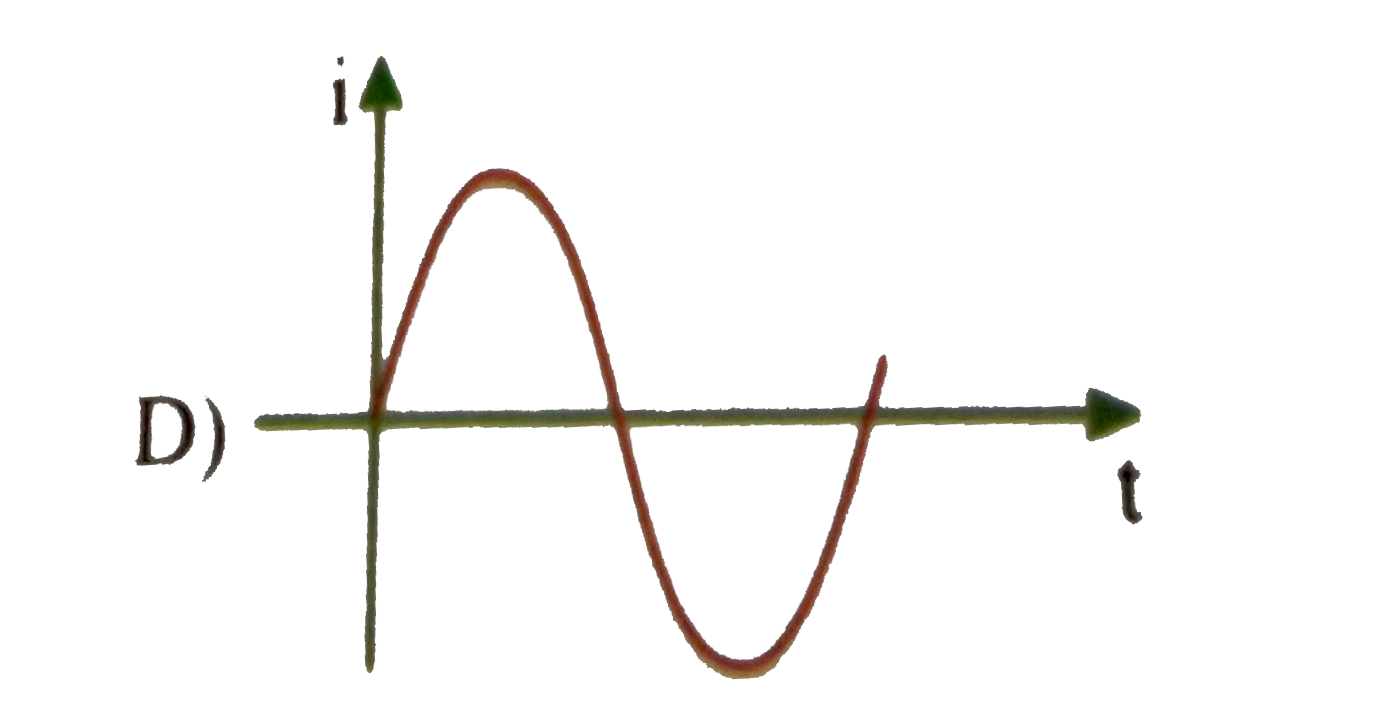
D
Text Solution
Verified by Experts
The correct Answer is:


Topper's Solved these Questions
Similar Questions
Explore conceptually related problems
NARAYNA-ALTERNATING CURRENT-LEVEL - V
- An electric bulb is designed to operate at 12 volts DC. If this bulb ...
Text Solution
|
- The current in a discharging LR circuit is given by I = i0 e^(-t/tau) ...
Text Solution
|
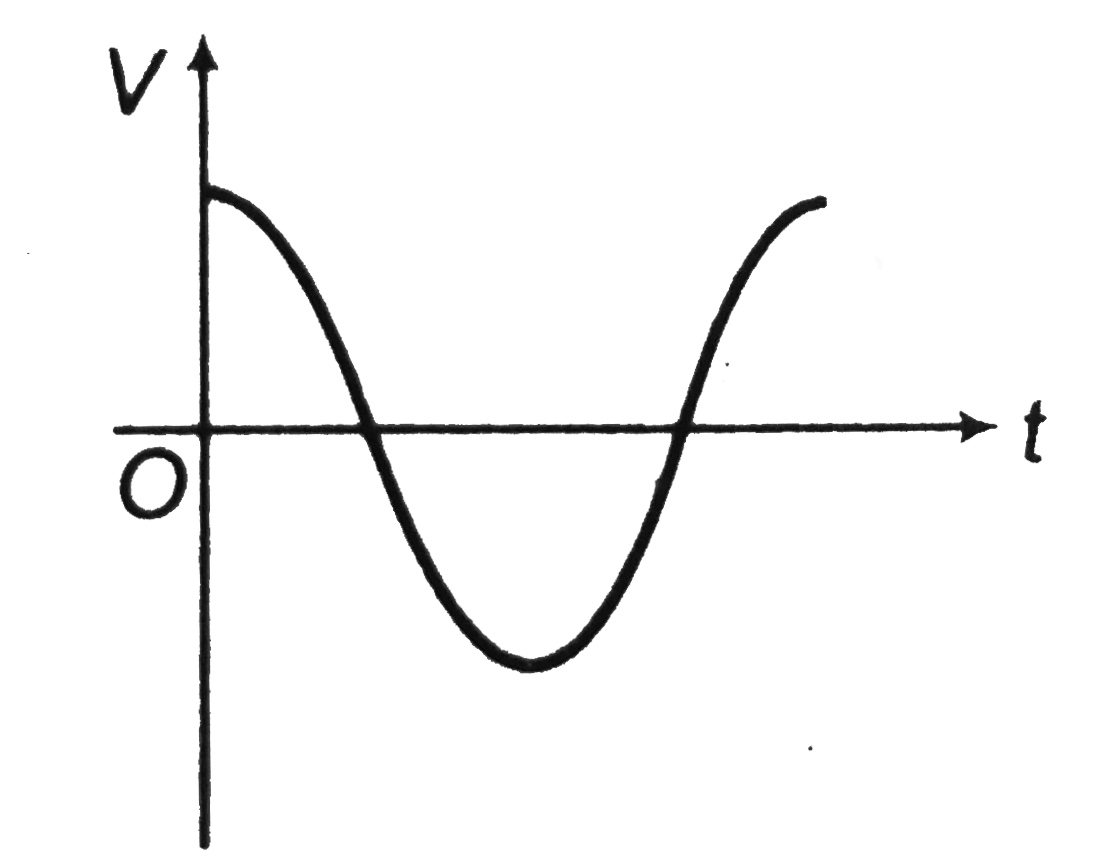
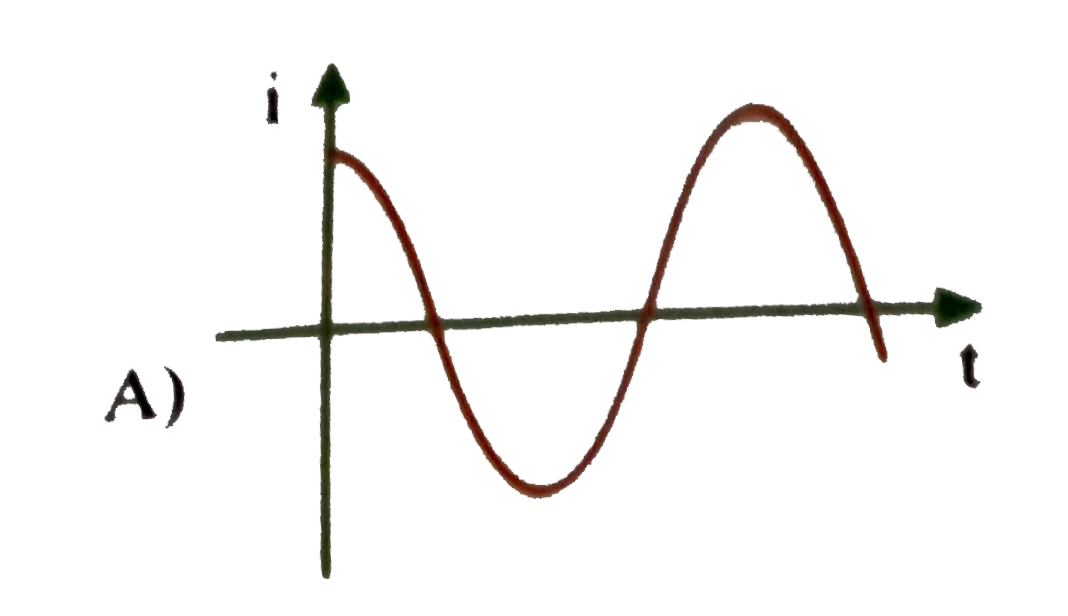
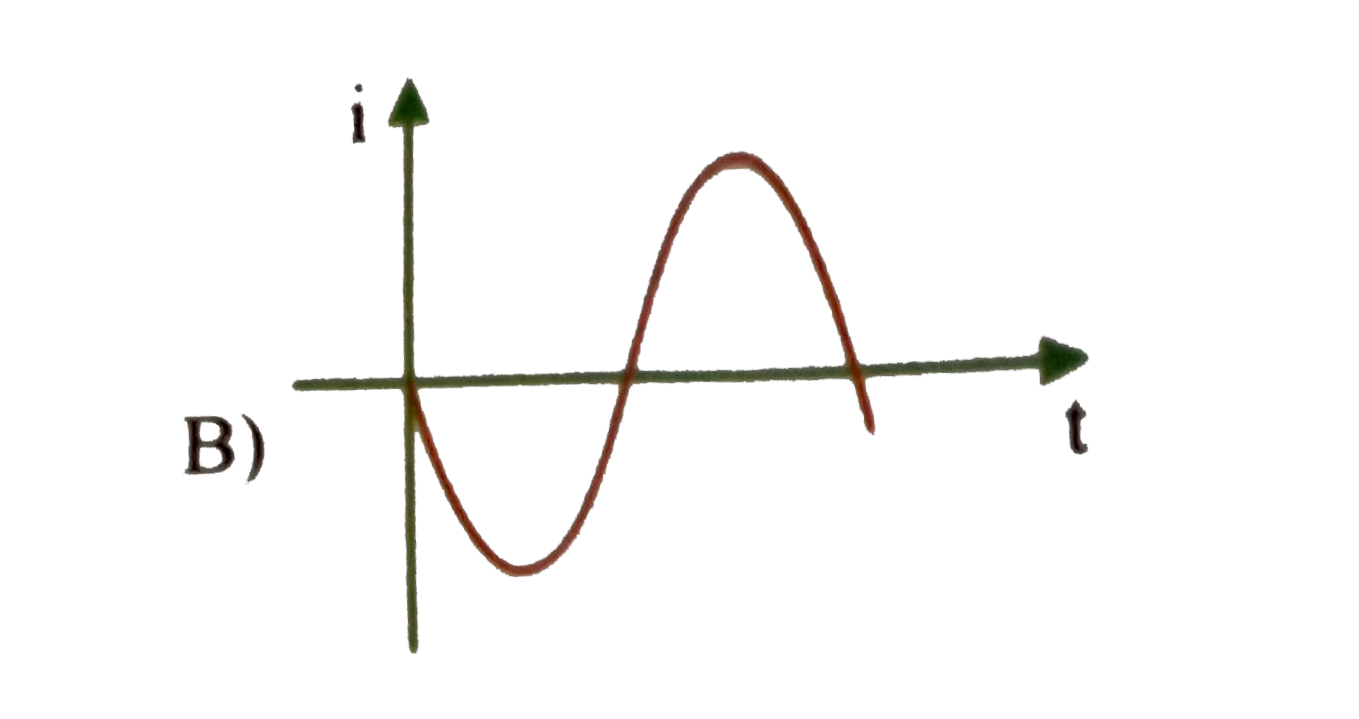
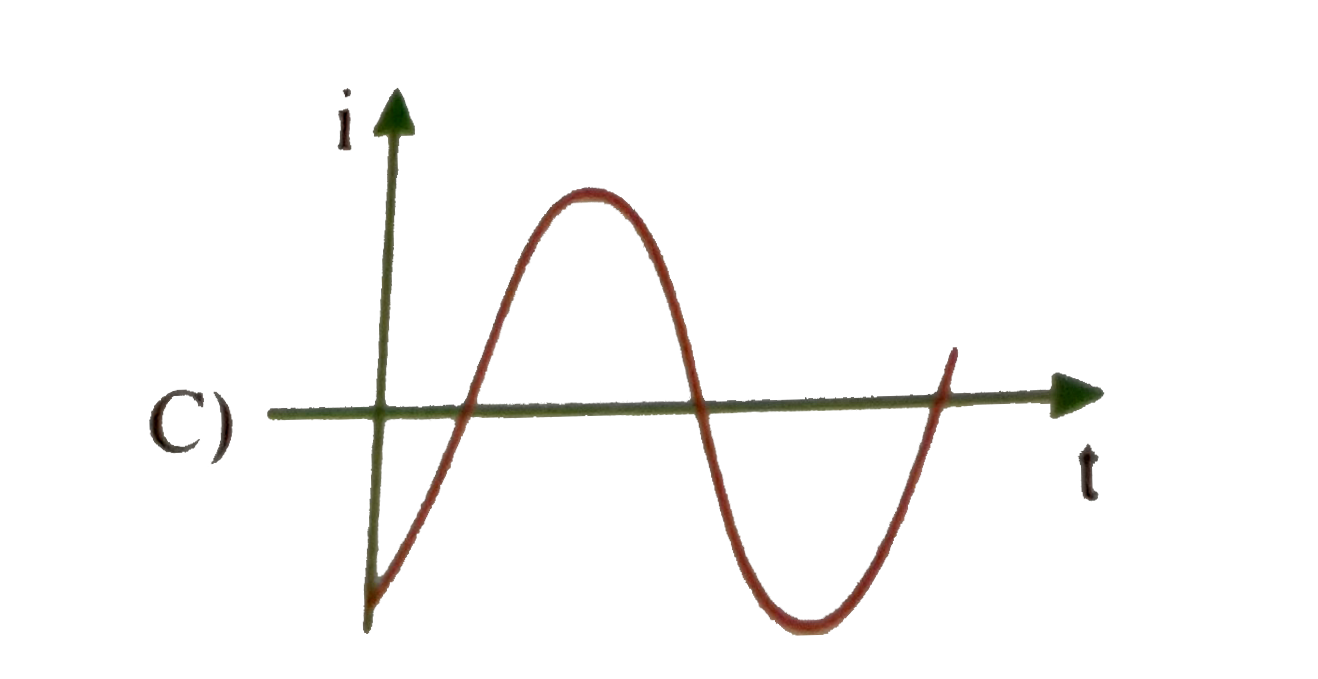
- The figure represents the voltage applied across a pure inductor. The ...
Text Solution
|
- A constant voltage at different frequencies is applied across a capaci...
Text Solution
|
- The resonance point in X(L) - f and X(C ) - f curves is
Text Solution
|
- When 100 V DC is applied across a solenoid, a current of 1.0 A flows i...
Text Solution
|
- A coil having an inductance of 1//pi henry is connected in series with...
Text Solution
|
- In a circuit containing an inductance of zero resistance, the current ...
Text Solution
|
- In RLC circuit, at a frequency v, the potential difference across each...
Text Solution
|
- The natural frequency of the circuit shown in the figure is
Text Solution
|
- If the phase difference between voltage and current is pi//6 and the r...
Text Solution
|
- In the circuit as shown in the figure, if value of R = 60 Omega, then ...
Text Solution
|
- The power in ac circuit is given by P=E(rms)I(rms)cosphi. The vale of ...
Text Solution
|
- A generator with an adjustable frequency of oscillaton is connected to...
Text Solution
|
- In the a.c circuit shown in figure, the supply voltage has a constant ...
Text Solution
|
- in a LCR circuit capacitance is chagned from C to 2C. For the resomat ...
Text Solution
|
- In an AC circuit, V and I are given by V=100sin(100t)volts, I=100sin(1...
Text Solution
|
- A series combination of R,LC is connected to an a.c source. If the res...
Text Solution
|
- In an a.c. Circuit the voltage applied is E=E(0) sin (omega)t. The res...
Text Solution
|
- In a series C-R circuit shown in figureure, the applied voltage is 10 ...
Text Solution
|