A
B
C
D
Text Solution
Verified by Experts
The correct Answer is:


Topper's Solved these Questions
Similar Questions
Explore conceptually related problems
NARAYNA-ALTERNATING CURRENT-LEVEL - V
- A lamp consumes only 50% of peak power in an a.c. circuit. What is the...
Text Solution
|
- Voltage and current for a circuit with two elements in series are expr...
Text Solution
|
- When an ac source of emfe=E(0) sin (100 t) is connected across a circu...
Text Solution
|
- The figure shows variation of R,X(L) and X(C) with frequency f in a se...
Text Solution
|
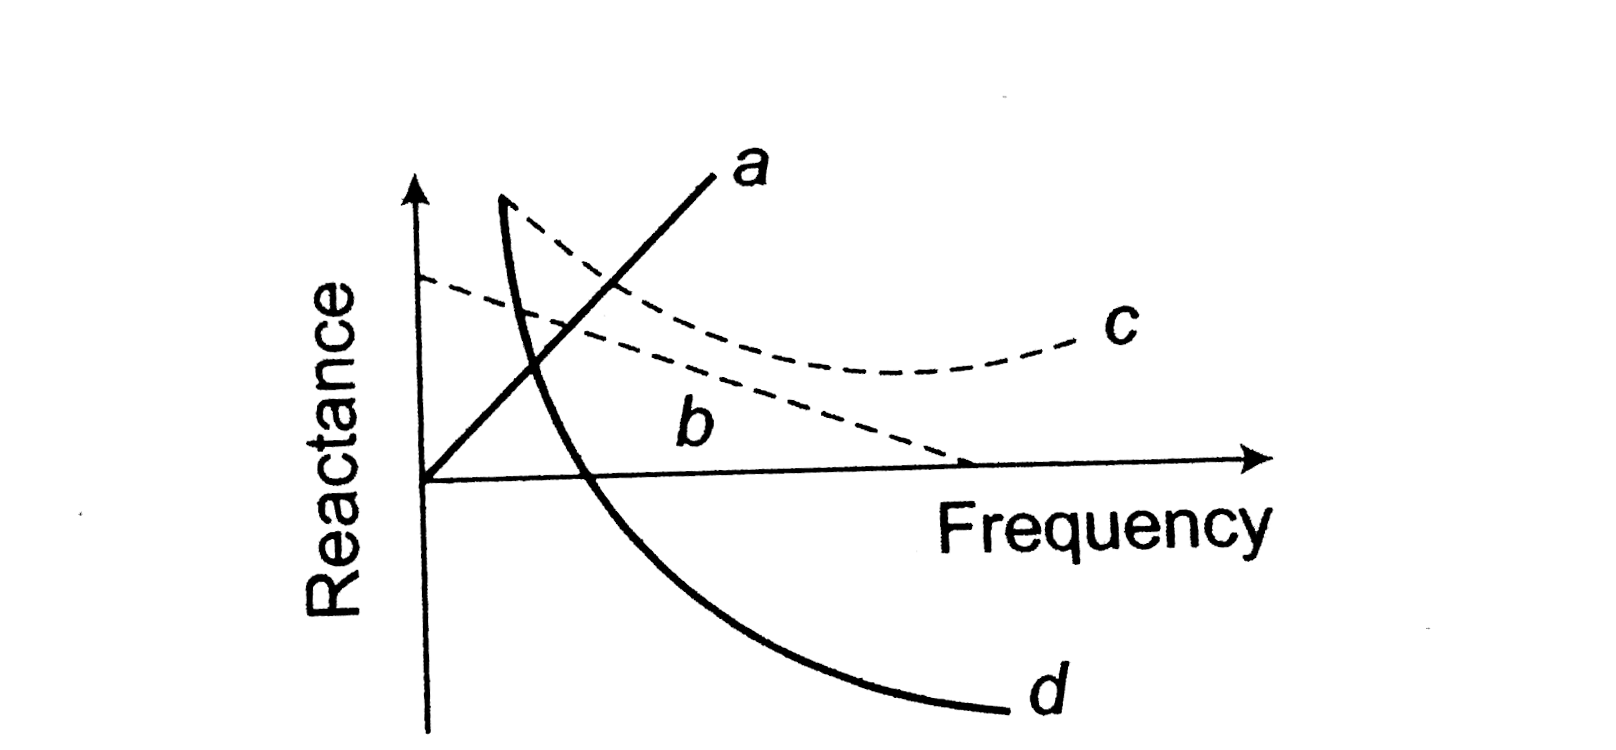
- Which of the following plots may represent the reactance of a series L...
Text Solution
|
- An inductor-coil , a capacitor and an AC source of rms voltage 24 V ar...
Text Solution
|
- A circuit consisting of a capacitor and a coil in series is connected ...
Text Solution
|
- An AC source producing emf epsilon = epsilon0 [cos(100 pi s^(-1)) t ...
Text Solution
|
- In the circuit shown in figureure the AC source gives a voltage V=20co...
Text Solution
|
- In figure i(1) = 10 e^(-2t) A, i(2) = 4 A, v(C ) = 3 e^(-2t) V Th...
Text Solution
|
- In figure i(1) = 10 e^(-2t) A, i(2) = 4 A, v(C ) = 3 e^(-2t) V Th...
Text Solution
|
- In figure i(1) = 10 e^(-2t) A, i(2) = 4 A, v(C ) = 3 e^(-2t) V Th...
Text Solution
|
- In figure i(1) = 10 e^(-2t) A, i(2) = 4 A, v(C ) = 3 e^(-2t) V Th...
Text Solution
|
- In figure i(1) = 10 e^(-2t) A, i(2) = 4 A, v(C ) = 3 e^(-2t) V Th...
Text Solution
|
- In figure i(1) = 10 e^(-2t) A, i(2) = 4 A, v(C ) = 3 e^(-2t) V Th...
Text Solution
|
- An ac generator G with an adjustable frequency of oscillation is used ...
Text Solution
|
- An ac generator G with an adjustable frequency of oscillation is used ...
Text Solution
|
- An ac generator G with an adjustable frequency of oscillation is used ...
Text Solution
|
- An ac generator G with an adjustable frequency of oscillation is used ...
Text Solution
|
- An ac generator G with an adjustable frequency of oscillation is used ...
Text Solution
|