A
B
C
D
Text Solution
Verified by Experts
The correct Answer is:


Topper's Solved these Questions
CHEMICAL KINETICS
PRADEEP|Exercise COMPETITION FOCUS (JEE(Main and Advanced)/Medical Entrance) (II. Multiple Choice Questions)|1 VideosCHEMICAL KINETICS
PRADEEP|Exercise COMPETITION FOCUS (JEE(Main and Advanced)/Medical Entrance) (I. Multiple Choice Questions) With one or more than one correct answers|7 VideosCHEMICAL KINETICS
PRADEEP|Exercise VALUE BASED QUESTIONS (WITH ANSWERS)|2 VideosBIOMOLECULES
PRADEEP|Exercise IMPORTANT QUESTIONS (FOR BOARD EXAMINATION)|25 VideosCHEMISTRY IN EVERYDAY LIFE
PRADEEP|Exercise IMPORTANT QUESTION FOR BOARD EXAMINATION|30 Videos
Similar Questions
Explore conceptually related problems
PRADEEP-CHEMICAL KINETICS-COMPETITION FOCUS (JEE(Main and Advanced)/Medical Entrance) (I. Multiple Choice Questions)
- The rate constant of the reaction A to B is 0.6xx10^(3) mole per litre...
Text Solution
|
- The half life of a substance in a certain enzyme catalyzed reaction is...
Text Solution
|
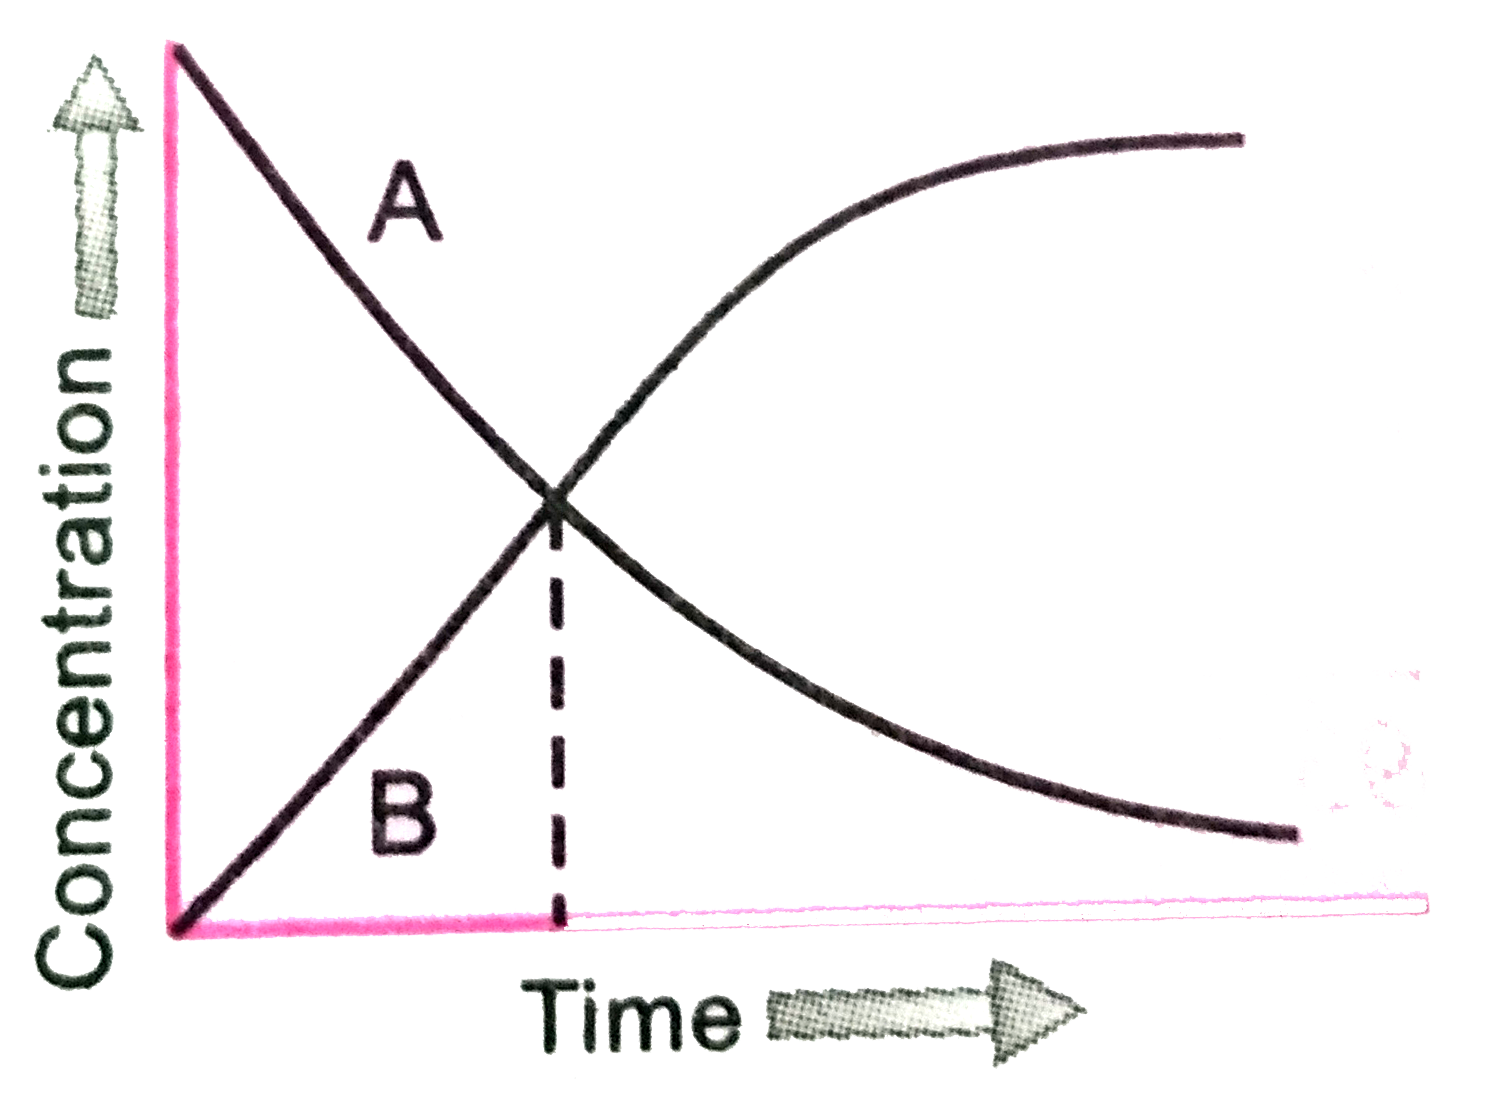
- The figure below depicts the change in the concentration of the specie...
Text Solution
|
- The plote between concentration versus time for a zero order reaction ...
Text Solution
|
- In the reaction, P+Q to R+S, the time taken for 75% reaction of P is...
Text Solution
|
- A first order reaction is carried out starting with 10" mol L"^(-1) of...
Text Solution
|
- Half-lives of a first order and a zero order reaction are same. Then t...
Text Solution
|
- For a first order reaction, the time taken to reduce the initial conce...
Text Solution
|
- The rate constant of a second order reactions 2A rarr Products, is 1...
Text Solution
|
- The time taken for 10 % completion of a first order reaction is 20 min...
Text Solution
|
- The following data is obtained during the first order thermal decompos...
Text Solution
|
- Rate constant of a reaction is 0.0693" min"^(-1). Starting with 10" mo...
Text Solution
|
- For the reaction A + 2B to C, the reaction rate is doubled if...
Text Solution
|
- The initial rates of reaction 3 A+ 2B +C rarr products at different in...
Text Solution
|
- At 500 K, the half-life period of a gaseous reaction at the initial pr...
Text Solution
|
- When initial concentration of a reactant is doubled in a reaction, its...
Text Solution
|
- The following graph shows how t(1//2) (half-life) of a reactant R chan...
Text Solution
|
- A reaction P rarr Q is completed 25 % in 25 min, 50 % completed in 25 ...
Text Solution
|
- t(1//4) can be taken as the time taken for concentration of reactant t...
Text Solution
|
- A plot of log t(1//2) versus log C(0) is given in the adjoining fig. T...
Text Solution
|