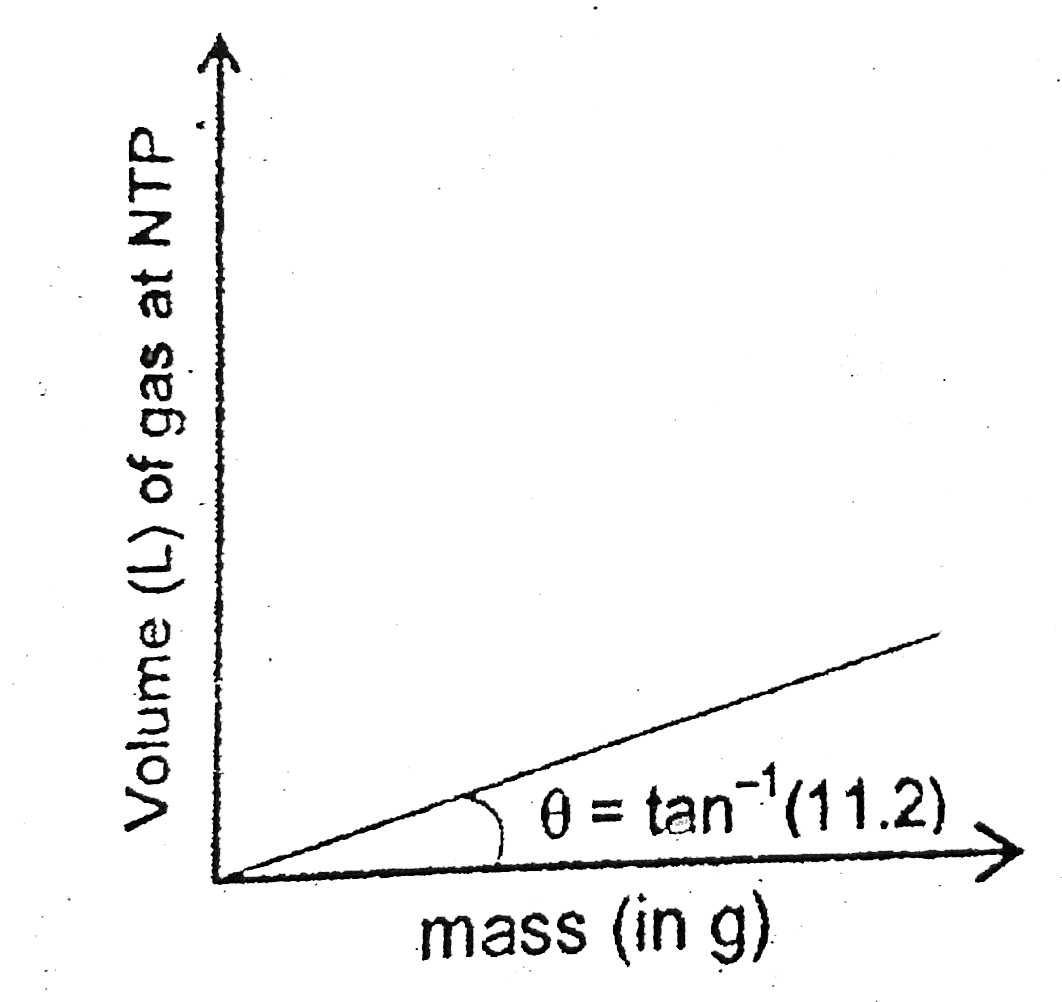
A graph is plotted for gas 'C' , by putting its weight (in gm) on X-axis and the Volume (L) of gas at NTP on Y-axis. Select the correct statement :
A
Atomic mass of gas is 2 amu.
B
Atomic mass of gas is 4 amu.
C
At NTP `5.6` L of gas will have mass equal to its molar mass.
D
At NTP `11.2` L of gas will have mass equal to its molar mass.
Text Solution
Verified by Experts
The correct Answer is:
A
Agraph is plotted for a gas 'C', by putting ………….. Mole `= (m(g))/(M)= (V_(L)(NTP))/(22.4)` `V = ((22.4)/(M))xxm` `implies ((22.4)/(M)) = 11.2 or M = 2`
Topper's Solved these Questions
TEST PAPERS
RESONANCE|Exercise PART - III CHEMISTRY SEC - 1|12 Videos
TEST PAPERS
RESONANCE|Exercise PART - III CHEMISTRY SEC - 2|18 Videos
SURFACE CHEMISTRY
RESONANCE|Exercise Section - 5|1 Videos
TEST SERIES
RESONANCE|Exercise CHEMISTRY|50 Videos
Similar Questions
Explore conceptually related problems
A graph is plotted for an element, by putting its weight on X-axis and the corresponding number of number of atoms on Y-axis. Determine the atomic weight of the element for which the graph is plotted.
If normal the curve y=f(x) is parallel to X-axis, then correct statement is
The graph given below shows the P-V plot for a process on an ideal gas. Select the correct statement.
Hydrogen gas and oxygen gas have volume 1 cm^(3) each at N.T.P. select incorrect statement/statements
By plotting log x/m on y-axis and log P on x-axis we s hould get
A sample of mono-atomic ideal gas is taken through a cyclic process ABCDA. A graph is plotted in which heat exchanged by the gas upto an instant is shown on x-axis and work done by the gas upto that instant is shown on y-axis. Choose incorrect statement:
Following graph is plotted between characteristics 'X' and 'Y' for three spices A, B and C . Now select the correct statement(s), relted to the above graph :
A graph was plotted taking the temperature in .^@C along the X-axis and the corresponding temperature in Kelvin along the Y-axis. Which of the curves in Fig, 6.1 most correctly represents this behaviour?