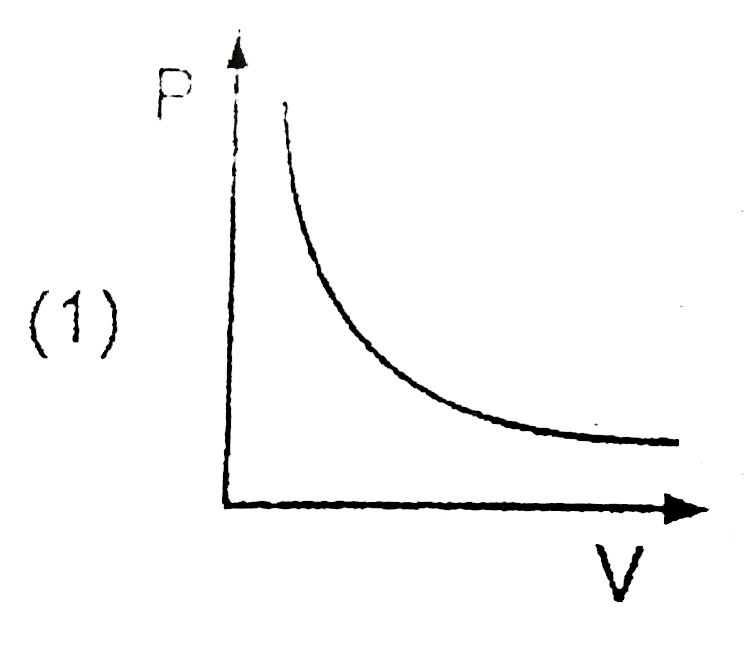
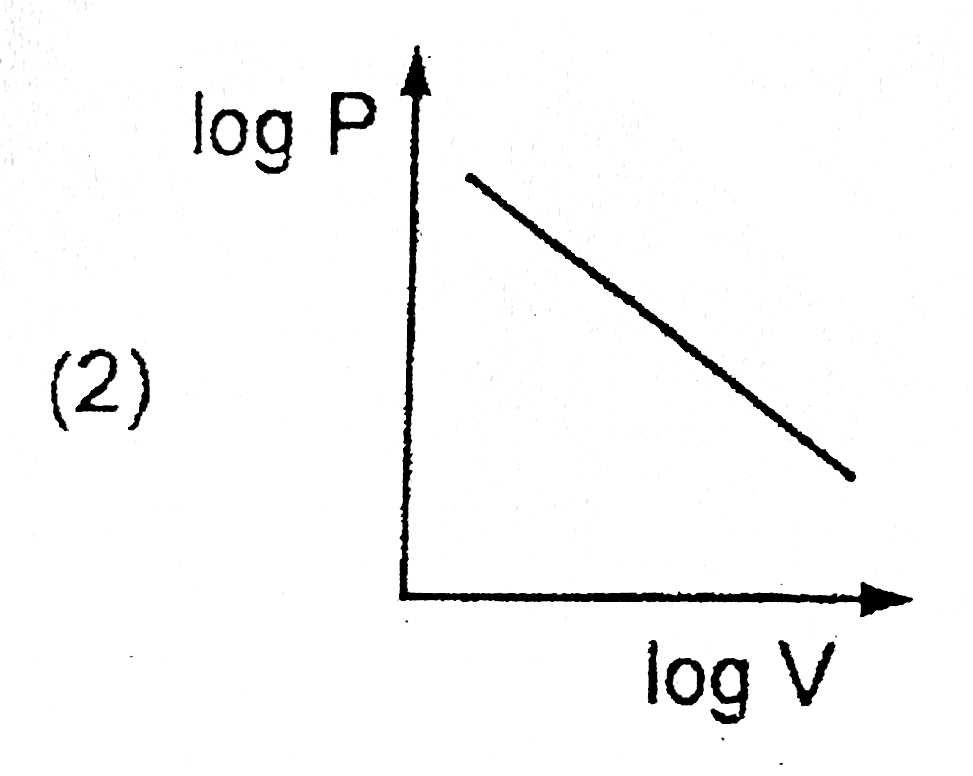
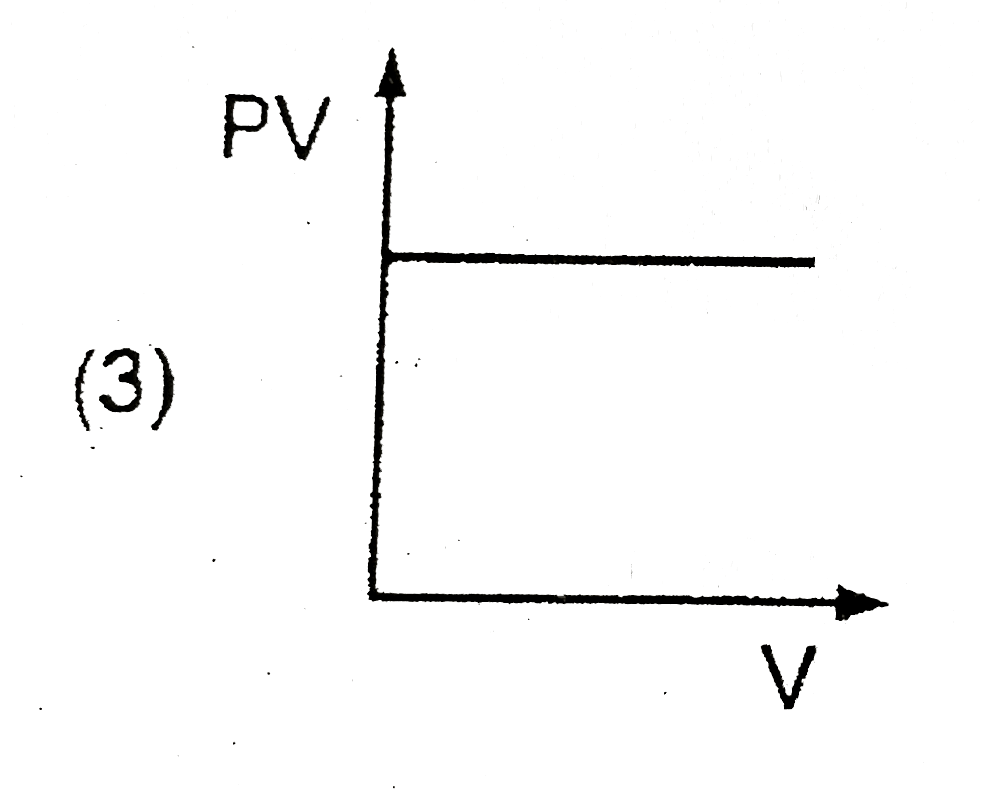
Which of the following graph represents Boyle's law ?
A
B
C
D
All of these
Text Solution
Verified by Experts
The correct Answer is:
D
Which of the following………….. `PV=K` (for same `n` and `T`) (Boyle's law) `log P= -log V+log K`
Topper's Solved these Questions
TEST PAPERS
RESONANCE|Exercise PART - III CHEMISTRY SEC - 1|12 Videos
TEST PAPERS
RESONANCE|Exercise PART - III CHEMISTRY SEC - 2|18 Videos
SURFACE CHEMISTRY
RESONANCE|Exercise Section - 5|1 Videos
TEST SERIES
RESONANCE|Exercise CHEMISTRY|50 Videos
Similar Questions
Explore conceptually related problems
Which of the following graph represent Boyle's law ?
Which of the following graphs represents Boyle's law correctly? (i)
Which of the following curves represent(s) Boyle's law?
which of the following graphs represents Charles' law correctly ?
Graph between pressure and volume are plotted at different temperature. Which of the following isotherms represent Boyle's law as PV = constant?
Graphs between pressure and volume are plotted at different temperatures . Which of the following isotherms represent Boyle's law as PV = constant ? (T_(1) gt T_(2) gt T_(3))
Which of the following graphs represents the correct Boyle's law ?