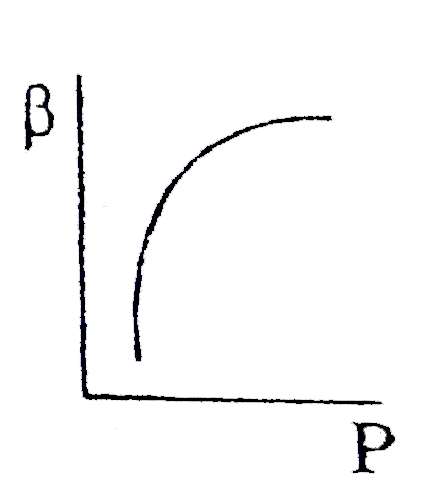
Which of the following graphs correctly represents the variation of `beta= -((dV)/(dP))//V` with `P` for an ideal gas at constant temperature
A
B
C
D
None of these
Text Solution
Verified by Experts
The correct Answer is:
A
From `PV = Rt , dV.P + V.dP = 0` or `((dV)/(dP)) = -(V)/(P)` or `beta = ((-dV)/(dP))_(T)//V = (1)/(2)` Thus plot of `beta` vs `P` given `(A)`
Topper's Solved these Questions
TEST PAPERS
RESONANCE|Exercise PART - III CHEMISTRY SEC - 1|12 Videos
TEST PAPERS
RESONANCE|Exercise PART - III CHEMISTRY SEC - 2|18 Videos
SURFACE CHEMISTRY
RESONANCE|Exercise Section - 5|1 Videos
TEST SERIES
RESONANCE|Exercise CHEMISTRY|50 Videos
Similar Questions
Explore conceptually related problems
which of the following graphs correctly represents the vatiation beta=-((dV)/(dP))_(T)//V with P for an ideal gas at constant temperature ? .
Which of following graphs correctly represent variation of alpha = (-(dV//dP)_(T))/(V) with P for fixed amount of an ideal gas at constant temperature ?
Which of the following graphs represent the behaviour of an ideal gas ?
Which one of the following graphs correctly gives the ideal gas behaviour ?
At a constant pressure, of the following graphs that one which represents the variation of the density of an ideal gas with the absolute temperature T, is
Which of following graphs correctly represents the variation of particle momentum with de-Broglie wavelength?