A
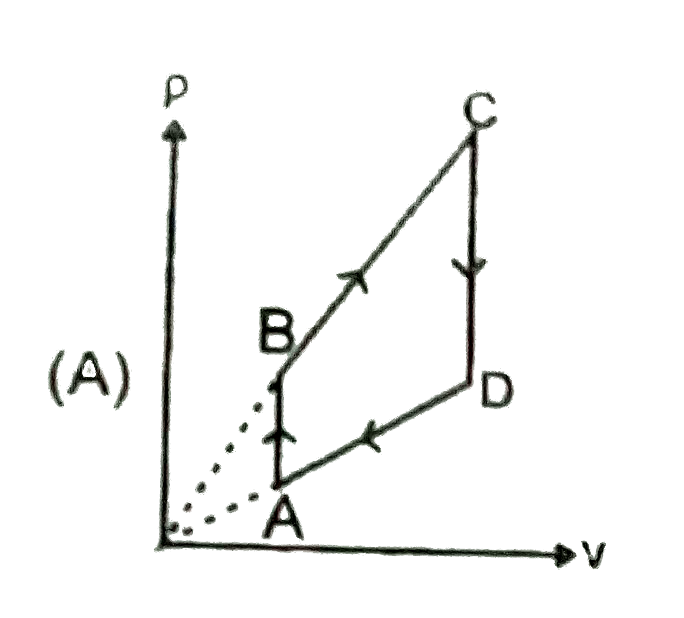
B

C
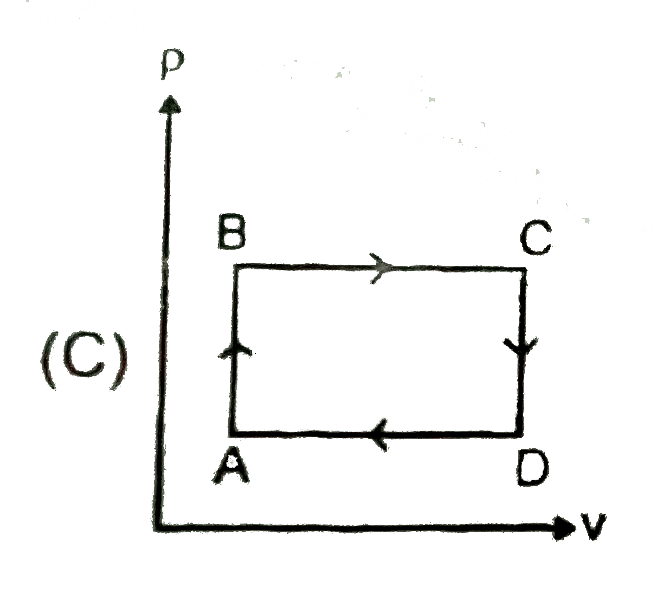
D

Text Solution
Verified by Experts
The correct Answer is:


Topper's Solved these Questions
KTG & THERMODYNAMICS
RESONANCE|Exercise SECTION (D)|2 VideosKTG & THERMODYNAMICS
RESONANCE|Exercise SECTION (I)|2 VideosKTG & THERMODYNAMICS
RESONANCE|Exercise SECTION (A)|3 VideosKINETIC THEORY OF GASES AND THERMODYNAMICS
RESONANCE|Exercise Exercise|64 VideosMAGNETIC FIELD AND FORCES
RESONANCE|Exercise Exercise|65 Videos
Similar Questions
Explore conceptually related problems
RESONANCE-KTG & THERMODYNAMICS-SECTION
- The quantity (2U)/(fkT) represents (where U = internal energy of gas)
Text Solution
|
- An ideal gas change from state a to state b as shown in Fig. what is t...
Text Solution
|
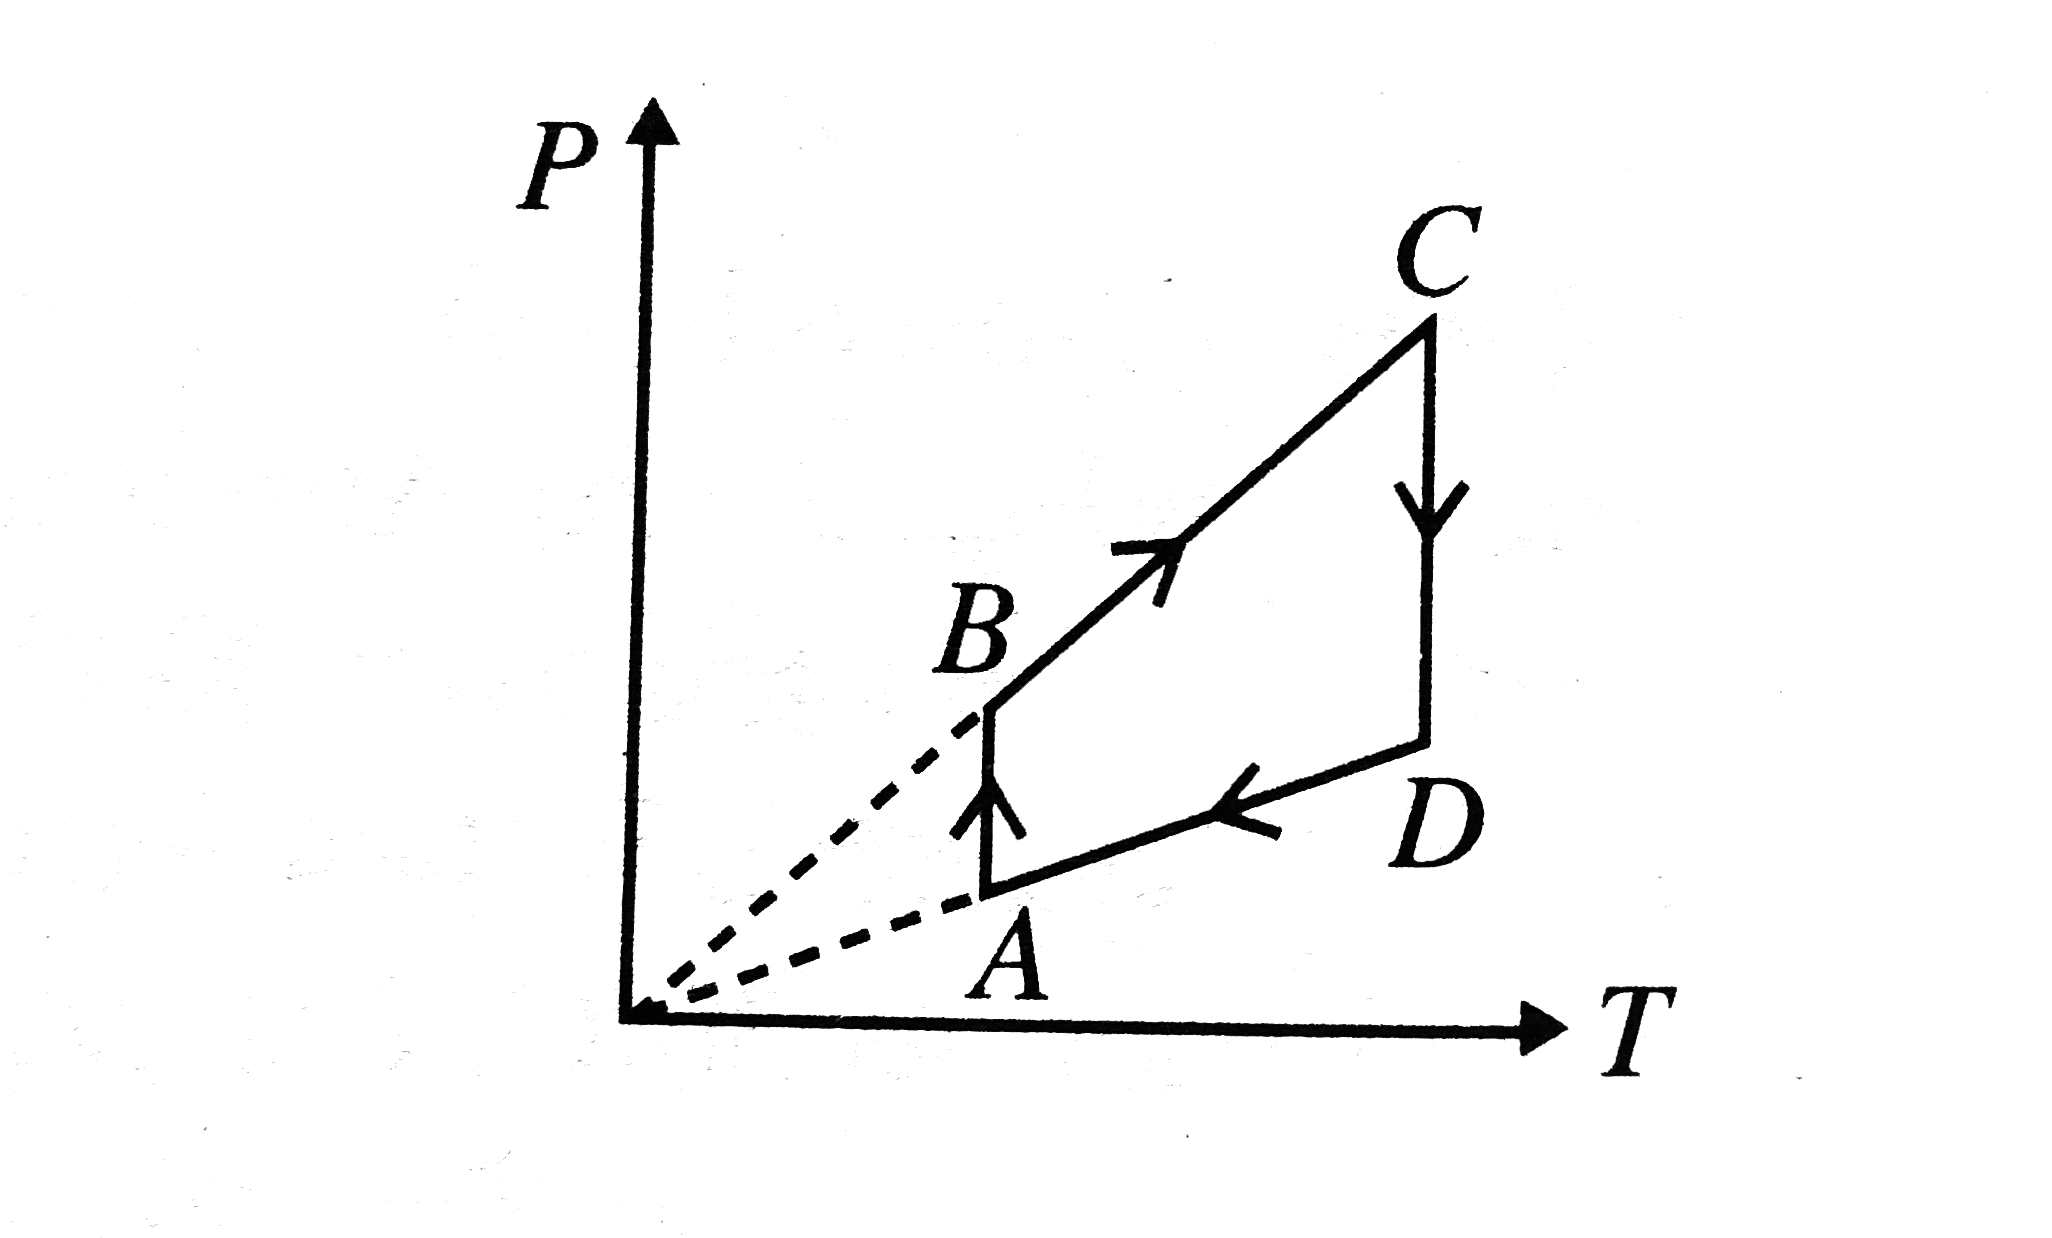
- Pressure versus temperature graph of an ideal gas as shown in Fig. C...
Text Solution
|
- The process DeltaU = 0, for an ideal gas can be best represented in th...
Text Solution
|
- In the given (V-T) diagram, what is the relation between pressure P(1)...
Text Solution
|
- In a cyclic process shown on the P -V diargam the magnitude of the wor...
Text Solution
|
- A fixed mass of an ideal gas undergoes changes of pressure and volume ...
Text Solution
|
- In figure, P-V curve of an ideal gas is given. During the process, the...
Text Solution
|
- Consider two processes on a system as shown in figure. The volumes in...
Text Solution
|
- A mass of an ideal gas undergoes a reversible isothermal compression. ...
Text Solution
|
- In the above question, if the work done on the system along the curved...
Text Solution
|
- In above question, if U(a) = 40J, value of U(b) will be
Text Solution
|
- In above question, if U(d) = 88J, heat absorbed for the path 'db' is
Text Solution
|
- Ideal gas is taken through the process shown in the figure :
Text Solution
|
- The value of the ratio C(P)//C(V) for hydrogen is 1.67 at 300K but dec...
Text Solution
|
- Boiling water is changing into steam. Under this condition the specifi...
Text Solution
|
- Supposing the distance between the atoms of a diatomic gas to be const...
Text Solution
|
- For an ideal gas, the heat capacity at constant pressure is larger tha...
Text Solution
|
- A gas has :
Text Solution
|
- If molar heat capacity of the given process (as shown in figure) is C,...
Text Solution
|