A
B
C
D
Text Solution
Verified by Experts
The correct Answer is:


Topper's Solved these Questions
DAILY PRACTICE PROBLEM
RESONANCE|Exercise DPP No.7|20 VideosDAILY PRACTICE PROBLEM
RESONANCE|Exercise DPP No.8|9 VideosDAILY PRACTICE PROBLEM
RESONANCE|Exercise DPP No.5|20 VideosCURRENT ELECTRICITY
RESONANCE|Exercise High Level Problems (HIP)|21 VideosELECTRO MAGNETIC WAVES
RESONANCE|Exercise Exercise 3|27 Videos
Similar Questions
Explore conceptually related problems
RESONANCE-DAILY PRACTICE PROBLEM-DPP No.6
- A person AB of height 170 cm is standing in front of a plane mirror. H...
Text Solution
|
- A small air bubble is trapped inside a transparent cube of size 12 cm...
Text Solution
|
- The positions of the object O (real or virtual) and the image I(real o...
Text Solution
|
- Which of the following do not form diminished virtual image of a real ...
Text Solution
|
- (a) Derive an expression for unit vector along reflected ray (hat r) i...
Text Solution
|
- A particle lies on the bottom of a tank T filled with water upto s hei...
Text Solution
|
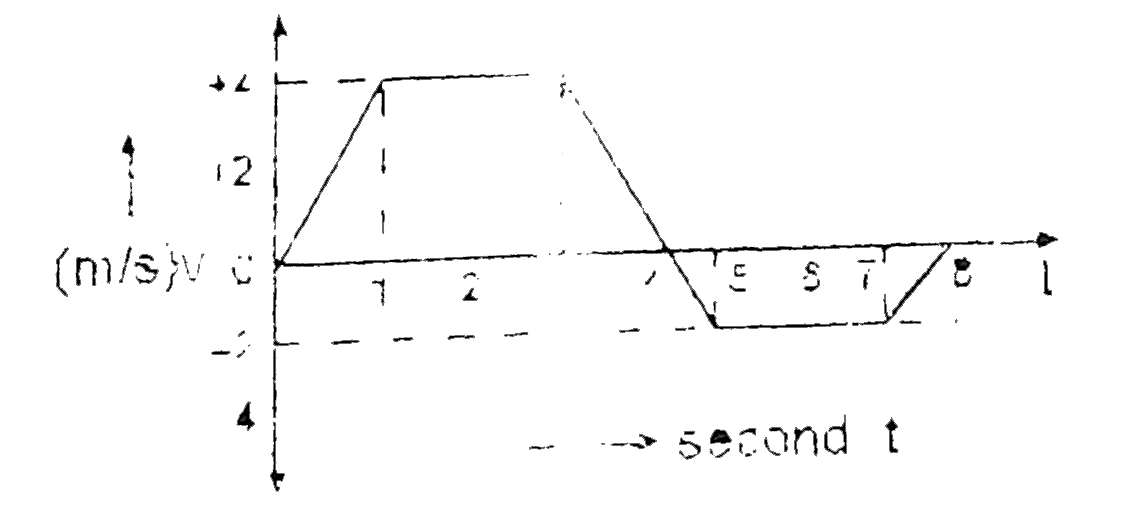
- The velocity time graph of a particle moving along a straight line is ...
Text Solution
|
- The velocity time graph of a particle moving along a straight line is ...
Text Solution
|
- The velocity time graph of a particle moving along a straight line is ...
Text Solution
|