 .
.A
B
C
D
Text Solution
Verified by Experts
The correct Answer is:


Topper's Solved these Questions
DAILY PRACTICE PROBLEM
RESONANCE|Exercise DPP No.8|9 VideosDAILY PRACTICE PROBLEM
RESONANCE|Exercise DPP No.9|20 VideosDAILY PRACTICE PROBLEM
RESONANCE|Exercise DPP No.6|9 VideosCURRENT ELECTRICITY
RESONANCE|Exercise High Level Problems (HIP)|21 VideosELECTRO MAGNETIC WAVES
RESONANCE|Exercise Exercise 3|27 Videos
Similar Questions
Explore conceptually related problems
RESONANCE-DAILY PRACTICE PROBLEM-DPP No.7
- A convex mirror of radius of curvature 20 cm is shown in figure. An ob...
Text Solution
|
- The focal length of convex tens is f and the distance of an object fro...
Text Solution
|
- A point object is moving along principal axis of concave mirror with u...
Text Solution
|
- The refractive index of air with respect to glass is 2//3. The refract...
Text Solution
|
- A mango tree is at the bank of a river and one of the branch of tree e...
Text Solution
|
- The circular boundary of the concave mirror subtends a cone of half an...
Text Solution
|
- In the figure shown. A particle P moves with velocity 10 m//s towards ...
Text Solution
|
- A metal coin at the bottom of a beaker filled with a liquid of refrac...
Text Solution
|
- A microscope is focused on a mark on a piece of paper and then a slab ...
Text Solution
|
- The speed of light in media M1 and M2 are 1.5 xx 10^8 m//s and 2.0 xx ...
Text Solution
|
- A ray of light travelling in a transparent medium f refractive index m...
Text Solution
|
- If the figure below, PQRS denotes the path followed by a ray of light ...
Text Solution
|
- A beam of light travelling with speed c in vacuum encounters a glass m...
Text Solution
|
- The acceleration of a particle travelling along a straight line is a =...
Text Solution
|
- Let r and r^(') denote the angles iniside an equilateral prism, as usu...
Text Solution
|
- A ball is released from the top of a to tower of heitht h It takes tim...
Text Solution
|
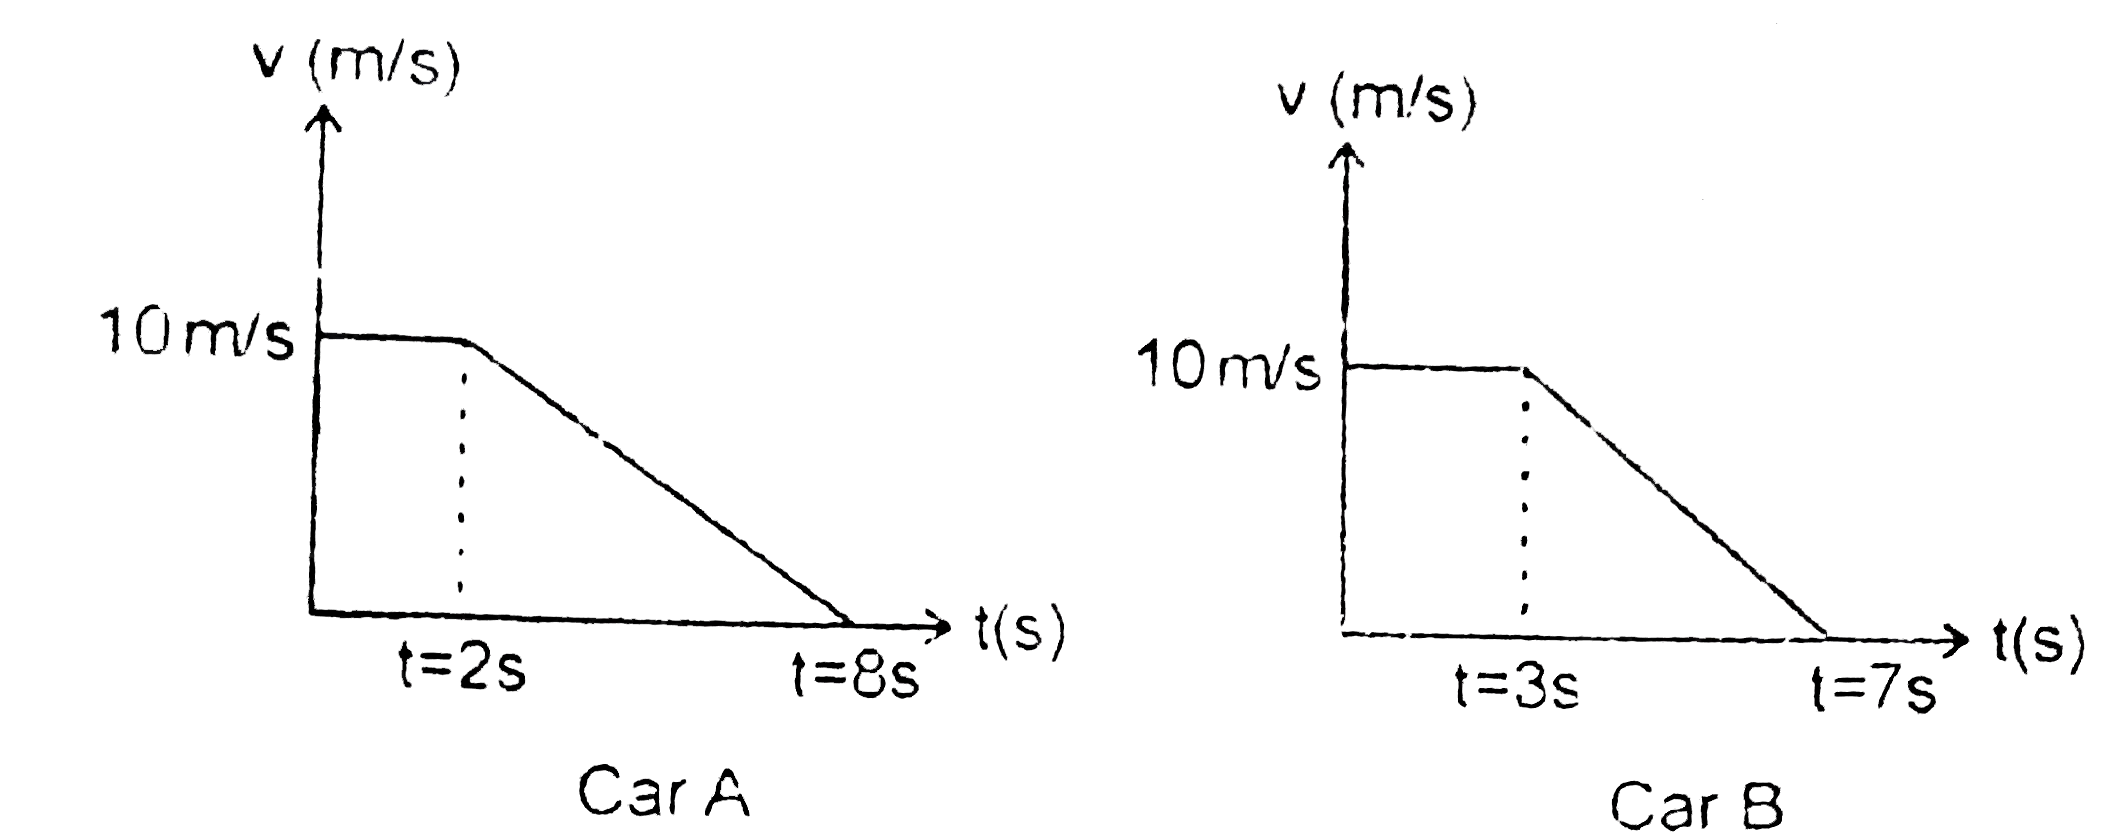
- Car A and car B move on a straight road and their velocity versus time...
Text Solution
|
- A particle travels from A to B path shown in figure, then the displace...
Text Solution
|
- Variation of displacement x of a particle moving on a straight line wi...
Text Solution
|
- A particle is moving in a straight line whose acceleration versus time...
Text Solution
|