A
B
C
D
Text Solution
Verified by Experts
The correct Answer is:


Topper's Solved these Questions
DAILY PRACTICE PROBLEM
RESONANCE|Exercise DPP No.32|9 VideosDAILY PRACTICE PROBLEM
RESONANCE|Exercise DPP No.33|20 VideosDAILY PRACTICE PROBLEM
RESONANCE|Exercise DPP No.30|9 VideosCURRENT ELECTRICITY
RESONANCE|Exercise High Level Problems (HIP)|21 VideosELECTRO MAGNETIC WAVES
RESONANCE|Exercise Exercise 3|27 Videos
Similar Questions
Explore conceptually related problems
RESONANCE-DAILY PRACTICE PROBLEM-DPP No.31
- A container of a large uniform cross-sectional area A resting on a hor...
Text Solution
|
- Three containers of same base area, same height are filled with three ...
Text Solution
|
- A ball is suspended from the top of a cart by a string of length 1.0m....
Text Solution
|
- An ideal fluid is flowing through the given tubes which is placed on a...
Text Solution
|
- Force F is given in terms of time t and distance x by F = A sin Ct + B...
Text Solution
|
- In the figure shown, blocks P and Q are in contact but do not stick to...
Text Solution
|
- In the above question, the velocity of the image of Q in plane mirror ...
Text Solution
|
- Free ^238 U nuclei kept in a train emit alpha particles. When the trai...
Text Solution
|
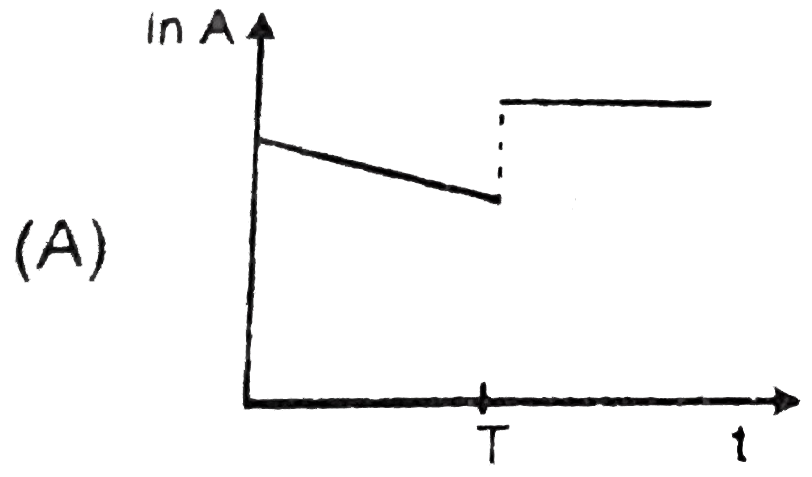
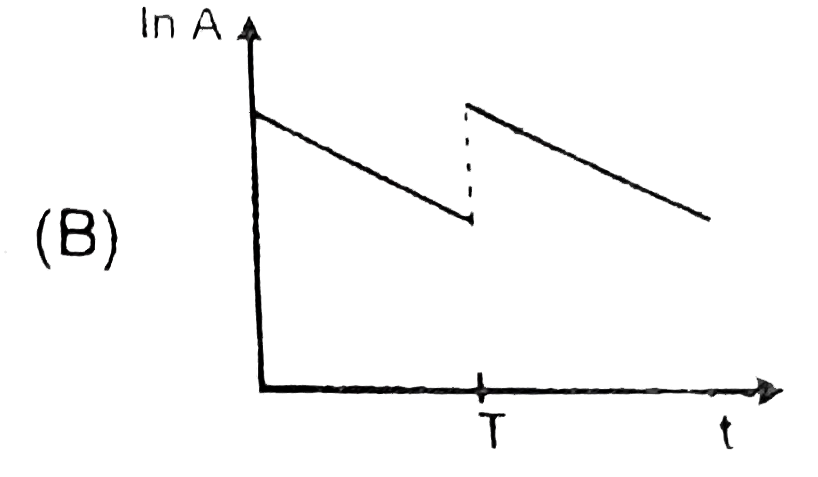
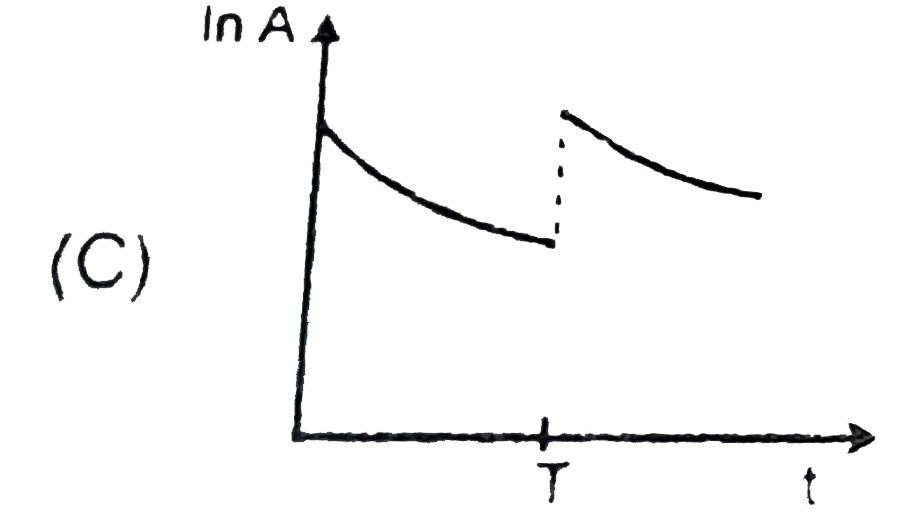
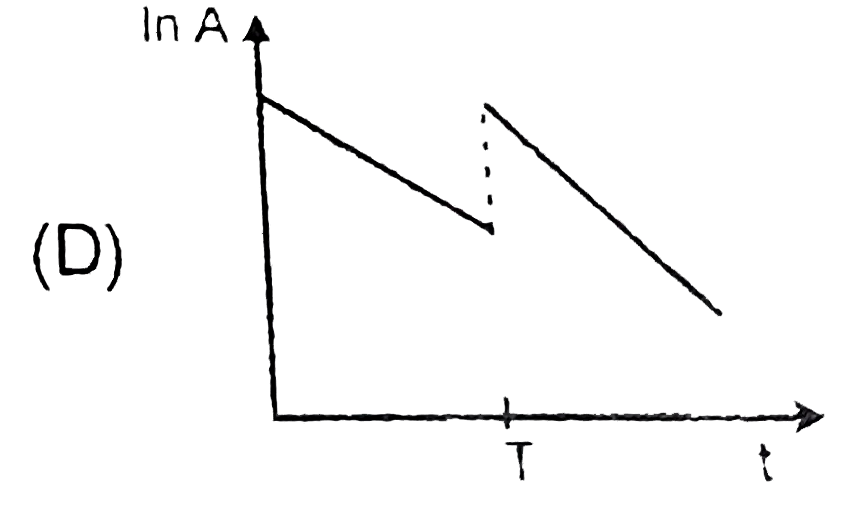
- At time t=0, some radioactive gas is injected into a sealed vessel. At...
Text Solution
|
- Let Fpp, Fpn and Fnn denote the magnitudes of the nuclear force by a p...
Text Solution
|
- A hemispherical portion of radius R is removed from the bottom of a cy...
Text Solution
|
- The density of ice is xgm//c c and that of water is y gm//c c. What is...
Text Solution
|
- A block of steel of size 5 cm xx 5cm xx 5cm is weighed in water. If th...
Text Solution
|
- Atomic weight of boron is 10.81 and it has two isotopes .5 B^10 and .5...
Text Solution
|
- Figure shows a uniformly charges hemispherical shell. The direction of...
Text Solution
|
- A non-conducting semi circular disc (as shown in figure) has a uniform...
Text Solution
|
- Three equal charges are placed at the three corners of an isoscles tri...
Text Solution
|
- Two small electric dipoles each of dipole moment p hati are situated a...
Text Solution
|
- A ring of radius R having a linear charge density lambda moves towards...
Text Solution
|
- Choose the correct ray diagram of an equi convex lens which is cut as ...
Text Solution
|