Home
Class 11
PHYSICS
Shown in the figure is the position-time...

Shown in the figure is the position-time graph for two chldren `(C_1` & `C_2)` going home from the school. Which of the following statements(s) about their relative motion is/are true after both of them started moving? Their relative velocity: (consider 1-D motion)

A

first increases and then decreases

B

first decreases and then increases

C

is zero

D

is non zero constant

Text Solution

Verified by Experts

The correct Answer is:
D

`upsilon_(1)`=slope of `C_(1)` line =constant
`upsilon_(2)`=slope of `C_(2)` line =constant
`upsilon_(1)-upsilon_(2) ne0` but constant
Promotional Banner

Topper's Solved these Questions

  • FLUID MECHANICS

    RESONANCE|Exercise Advanced Level Problems|8 Videos
  • FULL TEST 2

    RESONANCE|Exercise Exercise|30 Videos

Similar Questions

Explore conceptually related problems

Shown in the figure are the velocity time graphs of the two particles P_1 and P_2 . Which of the following statements about their relative motion is true ? Theire relative velocity

Shown in the figure are the velocity time graphs of the two particle P_(1) and P_(2) moving in same straight line in same direction. Which of the following statements about their relative motion is true? Their relative velocity

Figure shows the position-time graphs of three car A, B and C. On the basis of the graphs, answer the following questions : What is the relative velocity of car B with respect to car C ?

Figure shows the position-time graphs of three car A, B and C. On the basis of the graphs, answer the following questions : What is the relative velocity of car C with respect to car A ?

The figure shows position time graph of two riders C and D. Based on the information represented by the graph, answer the following questions. At t = 0 s

The figure shows position time graph of two riders C and D. Based on the information represented by the graph, answer the following questions. At t = 0 s

The figure shows position time graph of two riders C and D. Based on the information represented by the graph, answer the following questions. At t = 10 s

The figure shows position time graph of two riders C and D. Based on the information represented by the graph, answer the following questions. At t = 0 s

RESONANCE-FULL TEST 1-Exercise
  1. If two tuning forks A & B give 4 beats/sec. with each other, on loadin...

    Text Solution

    |

  2. Ball A of mass m, after sliding from an inclined plane, strikes elasti...

    Text Solution

    |

  3. The Vander wall equation for 1 mole of a real gas is (P+ (a/V^2))(V-b)...

    Text Solution

    |

  4. Which of the following quantities is/are always non-negative in a simp...

    Text Solution

    |

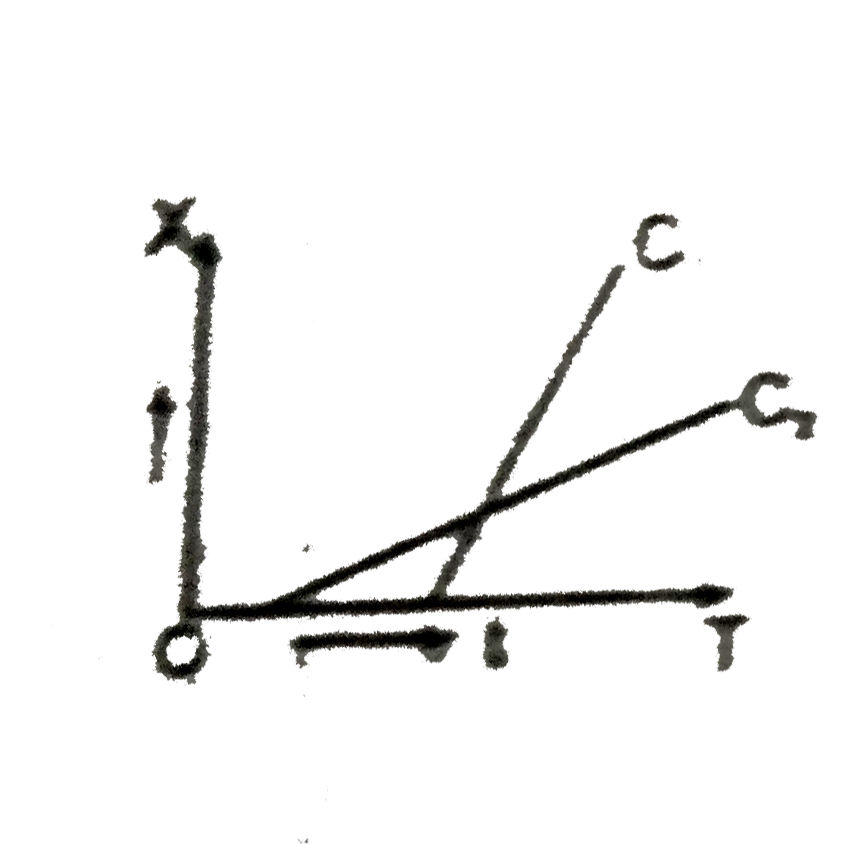
  5. Shown in the figure is the position-time graph for two chldren (C1 & C...

    Text Solution

    |

  6. The minimum acceleration that must be impprted to the cart in the figu...

    Text Solution

    |

  7. A rigid body moves a distance of 10m along a straight line under the a...

    Text Solution

    |

  8. Two particles p and q located at distances rp and rq respectively from...

    Text Solution

    |

  9. A 10 kg block is pulled in the vertical plane along a frictionless sur...

    Text Solution

    |

  10. A narrow tube completely filled with a liquid is lying on a series of ...

    Text Solution

    |

  11. Two wires of the same material and length but diameters in the ratio 1...

    Text Solution

    |

  12. A liquid rises in a capillary tube when the angle of contact is:

    Text Solution

    |

  13. A uniform rod of mass m and length L is suspended with two massless st...

    Text Solution

    |

  14. A wide vessel with a small hole at the bottom is filled with two liqui...

    Text Solution

    |

  15. A particle of mass m starts to slide down from the top of the fixed sm...

    Text Solution

    |

  16. In a river of 20 m width. Half part of river flows with speed 10 m//se...

    Text Solution

    |

  17. Two vibrating strings of same material stretched under same tension an...

    Text Solution

    |

  18. The (x - t) graph of a particle undergoing simple harmonic motion is s...

    Text Solution

    |

  19. Statement 1: In sound waves variation of pressure and density of a gas...

    Text Solution

    |

  20. Statement 1: While drawing a line on a paper by pencil, friction force...

    Text Solution

    |