Text Solution
Verified by Experts


Topper's Solved these Questions
Similar Questions
Explore conceptually related problems
RESONANCE-ATOMIC PHYSICS-Exercise -3 part -I JEE (Advanced)
- Define ionisation energy. What is the value for a hydrogen atom?
Text Solution
|
- Write Einstein's photoelectric equation. State clearly any two salient...
Text Solution
|
- Deduce an expression for the magnetic dipole moment of an electron orb...
Text Solution
|
- Define the term 'stopping potential' in relation to photoelectric effe...
Text Solution
|
- (a) Using de Broglie's hypothesis, explain with the help of a suitable...
Text Solution
|
- A proton and an electron have same velocity. Which one has greater de-...
Text Solution
|
- Using Einstein's photoelectric equation show how the cut -off voltage ...
Text Solution
|
- A nuclear fusion reaction is given by .(1)H^(2)+.(1)H^(2)rarr.(1)He^...
Text Solution
|
- Using Bohr's postulates, obtain the expression for the total energy of...
Text Solution
|
- Define the following in photoelectric effect phenomenon (a) (i) work...
Text Solution
|
- Calculate de Broglie wavelength associated with an electron, accelerat...
Text Solution
|
- Write Bohr's any two postulates for hydrogen atom.
Text Solution
|
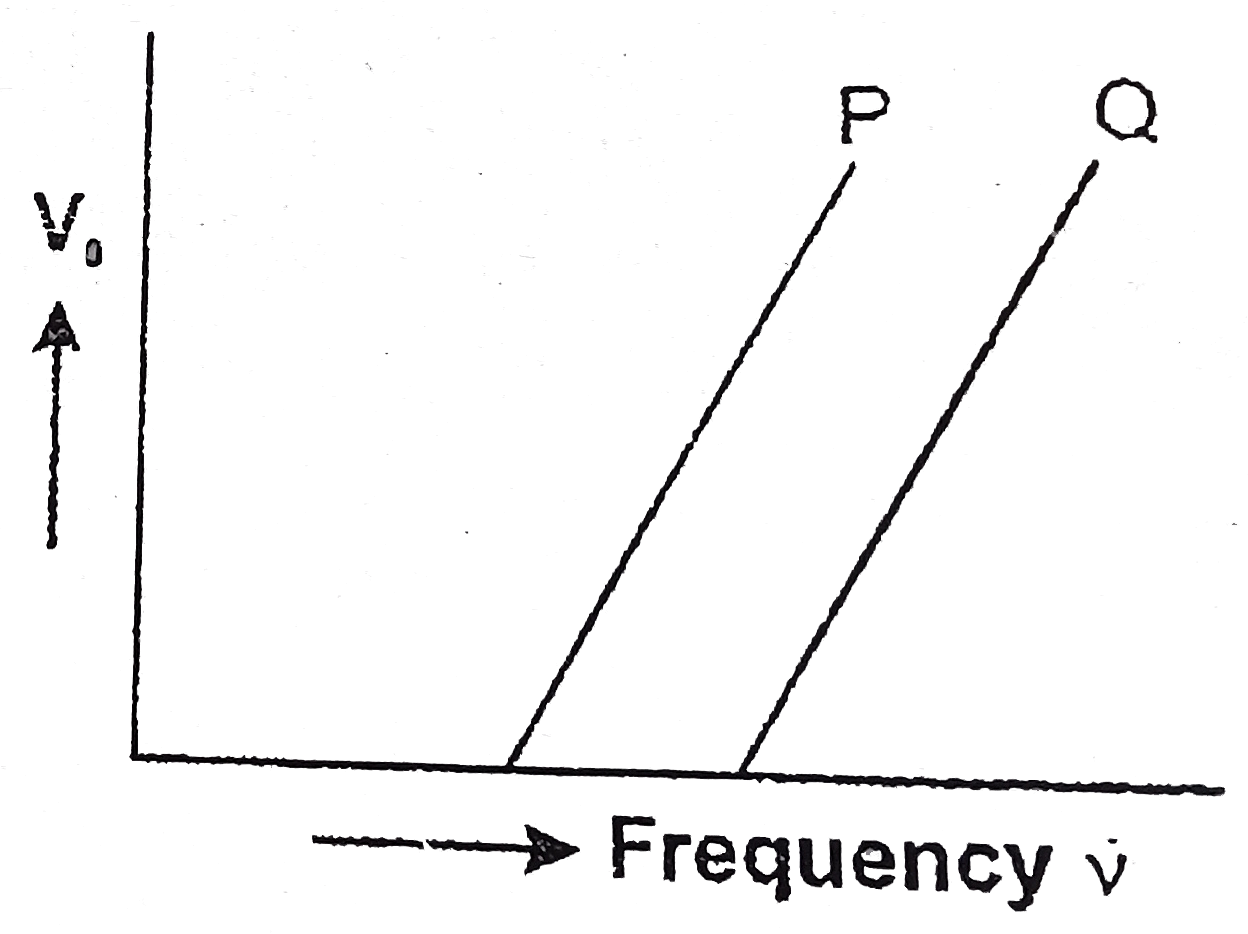
- The graph shows variation of stopping potential V(0) versus frequency ...
Text Solution
|
- Why is it found experimentally difficult to detect neutrinos in nuclea...
Text Solution
|
- Using Rautherfold model of the atom, derive the expression for the tot...
Text Solution
|
- An electron microscope uses electrons accelerated by a voltage of 50kV...
Text Solution
|
- A ball of mass 0.12 kg is moving with a speed 20 m//s. Calculate the d...
Text Solution
|
- The graph between the stopping potential V(0) and frequency v for two ...
Text Solution
|
- A monochromatic light source of frequency 6xx10^(14)Hz is emitting ene...
Text Solution
|
- The ground state energy of hydrogen atom is-13.6 eV. What are the kine...
Text Solution
|