A
B
C
D
Text Solution
Verified by Experts
The correct Answer is:


Topper's Solved these Questions
Similar Questions
Explore conceptually related problems
KAPLAN-FUNCTIONS -FUNCTIONS FOLLOW - UP TEST
- If f(x)=x^(2)+2x-2 and if f(s-1)=1, what is the smallest possible valu...
Text Solution
|
- If f(x)=2x^(3) and g(x)=3x, what is the value of g(f(-2))-f(g(-2)) ?
Text Solution
|
- For what value of x is |16-(x+5)^(2)| at its minimum ?
Text Solution
|
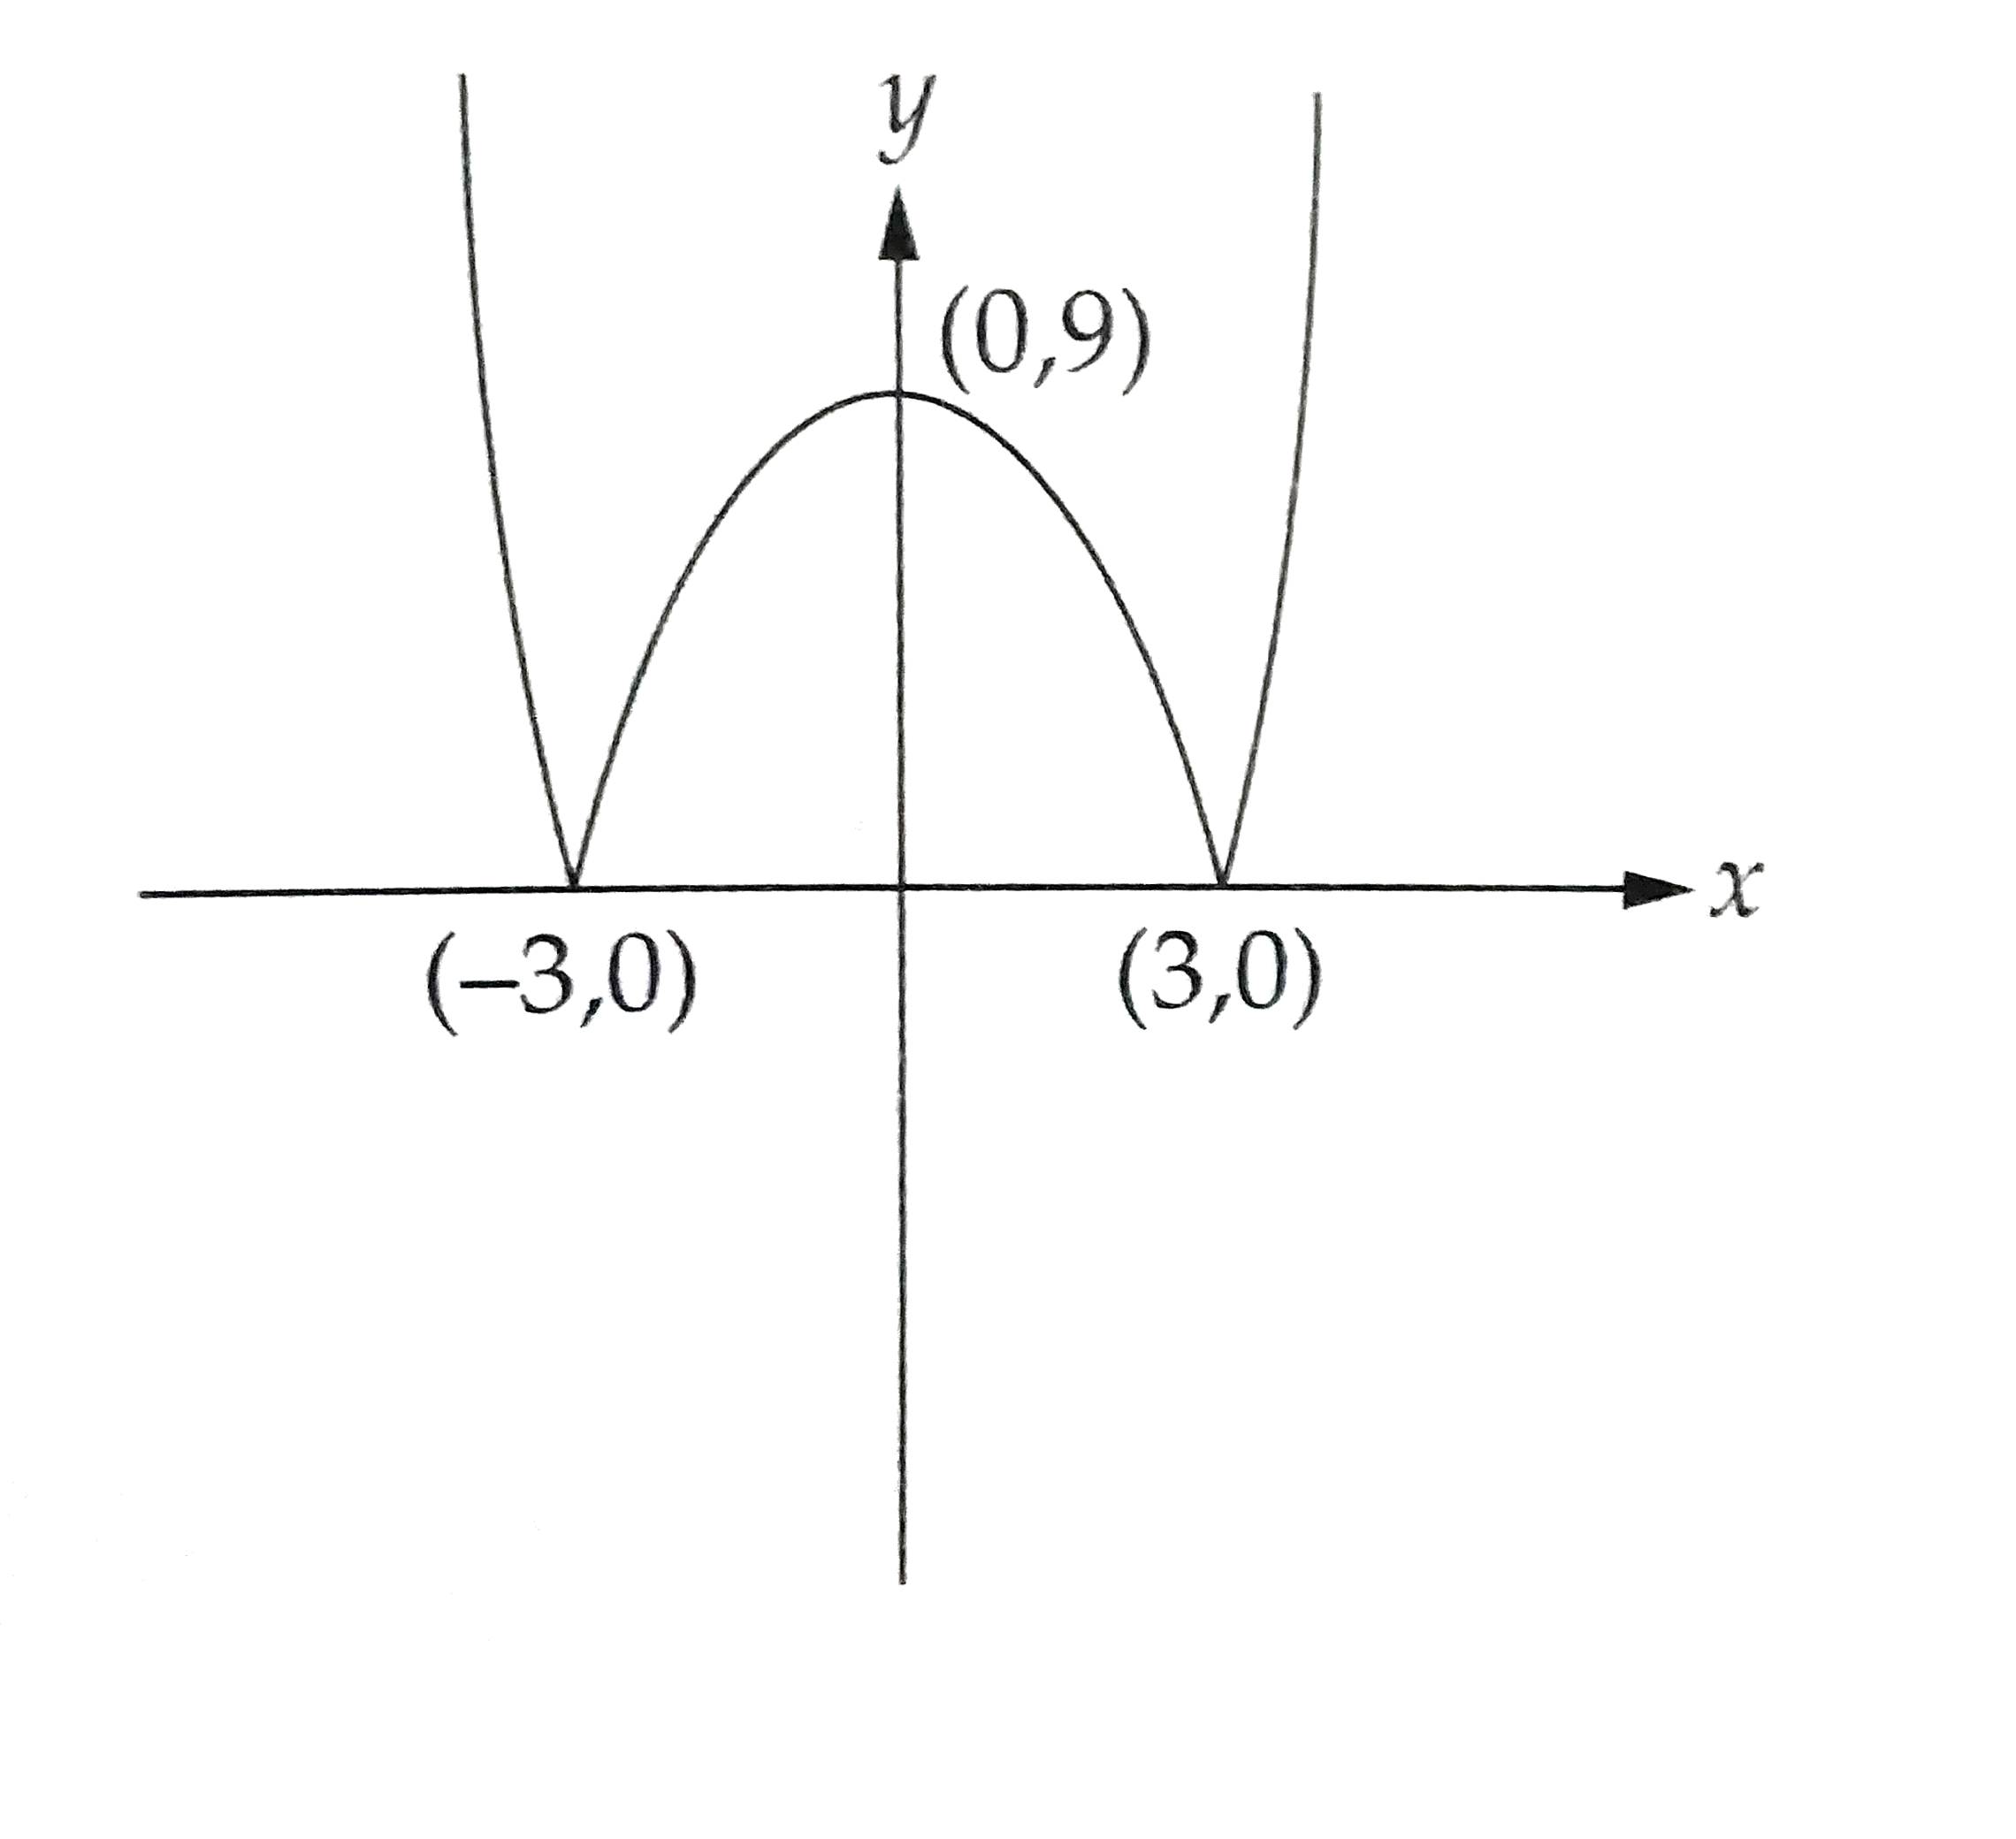
- The graph in Figure could be the graph of which of the following funct...
Text Solution
|
- If f(x)=(1)/(sqrt(1-x^(2))), which of the following describes all the ...
Text Solution
|
- If f(x) is a linear function and the slope of y=f(x) is (1)/(2), what ...
Text Solution
|