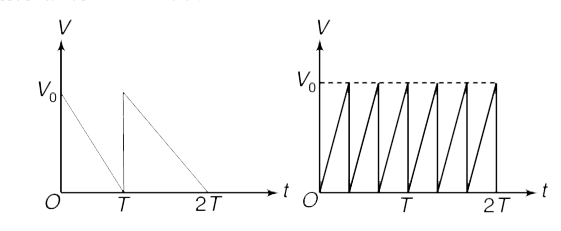
Which of the two waveforms shown in Figure has a higher average value?
Text Solution
Verified by Experts
The correct Answer is:
Both have same average
Topper's Solved these Questions
ALTERNATING CURRENT
ARIHANT|Exercise level-2|15 Videos
ALTERNATING CURRENT
ARIHANT|Exercise level-3|1 Videos
CAPACITOR
ARIHANT|Exercise Capacitor|50 Videos
Similar Questions
Explore conceptually related problems
Which of the two waveforms shown in Figure has a higher rms value?
In the two circuits shown in figure
Which sample A or B shown in figure has shorter mean-life ?
Input waveforms A and B as shown in Fig-l are applied to the combination of gates as shown in Fig-ll. Which of the waveforms shown in Fig.(i) to (iv) correctly represents the output waveform?
Input waveforms A and B as shown in Fig-l are applied to the combination of gates as shown in Fig-ll. Which of the waveforms shown in Fig.(i) to (iv) correctly represents the output waveform?
Which of the following ideal gases has higher value of average kinetic energy per mole at the same temperature - N_2,CO_2,O_2 ?
Which of the following has a higher value for K_(h) at 27^(0)c
Which of the following has/have zero average value in a plane electromagnetic wave?
A voltage waveform is as shown in the Figure calculate the ratio of rms value and average value of the voltage.
The initial and final velocities of an object are as shown in figure. Which arrows shown in figure can be represent average acceleration vector?