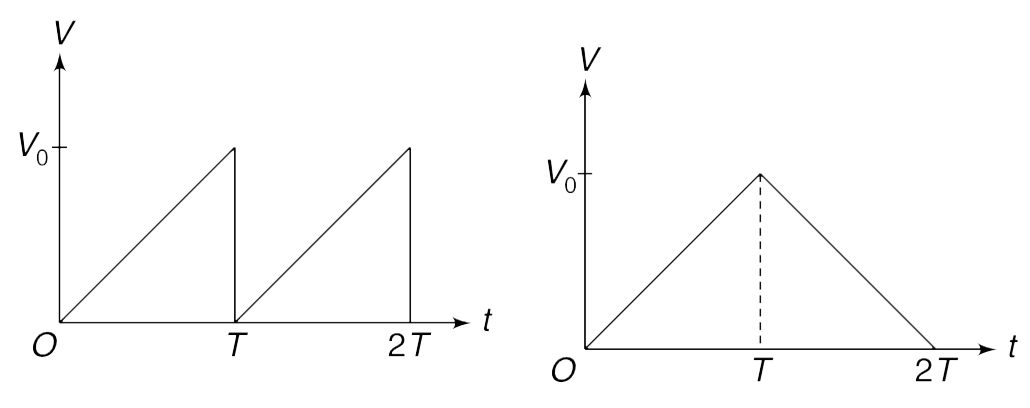
Which of the two waveforms shown in Figure has a higher rms value?
Text Solution
Verified by Experts
The correct Answer is:
Both have same value
Topper's Solved these Questions
ALTERNATING CURRENT
ARIHANT|Exercise level-2|15 Videos
ALTERNATING CURRENT
ARIHANT|Exercise level-3|1 Videos
CAPACITOR
ARIHANT|Exercise Capacitor|50 Videos
Similar Questions
Explore conceptually related problems
Which of the two waveforms shown in Figure has a higher average value?
In the two circuits shown in figure
Input waveforms A and B as shown in Fig-l are applied to the combination of gates as shown in Fig-ll. Which of the waveforms shown in Fig.(i) to (iv) correctly represents the output waveform?
Input waveforms A and B as shown in Fig-l are applied to the combination of gates as shown in Fig-ll. Which of the waveforms shown in Fig.(i) to (iv) correctly represents the output waveform?
A voltage waveform is as shown in the Figure calculate the ratio of rms value and average value of the voltage.
Which one of the two, an ammeter or a milliammeter, has a higher resistance and why?
Which sample A or B shown in figure has shorter mean-life ?
The average and RMS value of voltage for square wave shown in figure-5.254 having peak value V_(0) are: