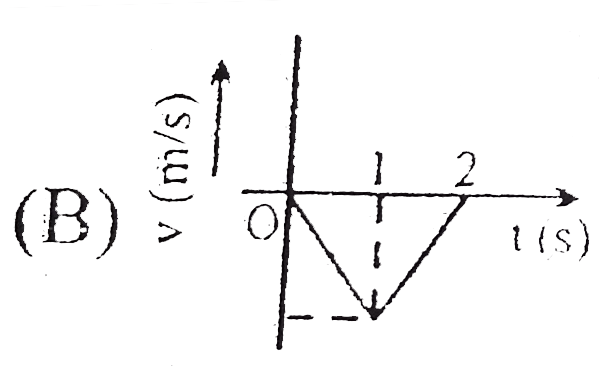
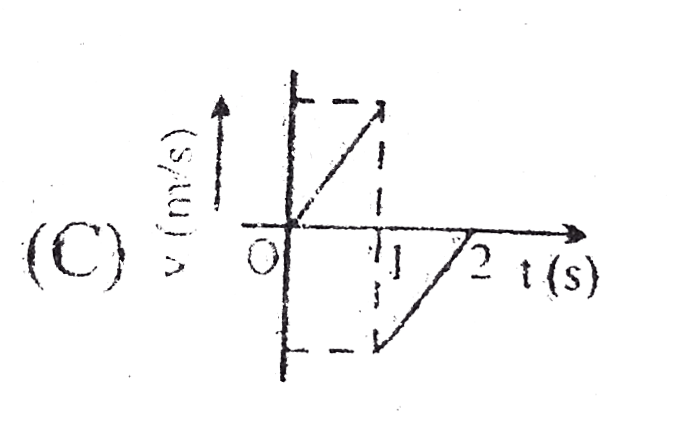
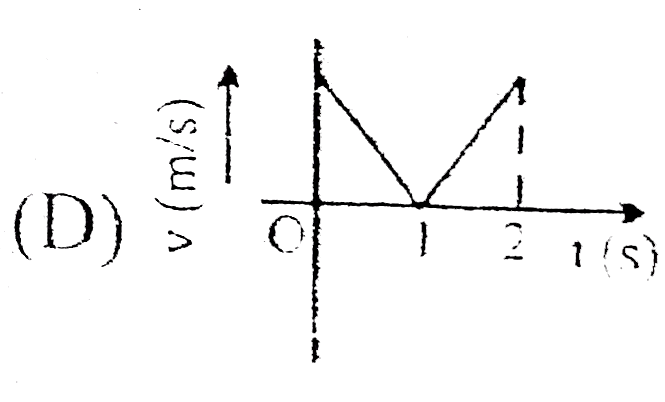
Home
Class 12
PHYSICS
The displacement-time graph of a moving ...

The displacement-time graph of a moving particle with constant acceleration is shown in. The velocity-time is given by
.

A

B

C

D

Text Solution

Verified by Experts

The correct Answer is:
A

`From big :-
For time interval `t=0` to `t=1sec`
slope of x-t graph os negative and increasing so velocity increases in negative direction
` For t=1 to 2sec`
The slope is +ve and decreasing so velocity is decreasing in + ve direction and become zero at so (A) is correct
Promotional Banner

Topper's Solved these Questions

  • MASTER PRACTICE PROBLEM

    BANSAL|Exercise Comphrehension|134 Videos
  • MASTER PRACTICE PROBLEM

    BANSAL|Exercise Reasoning|75 Videos
  • FLUID MECHANICS

    BANSAL|Exercise PYQS AIEEE|10 Videos
  • SEMICONDUCTORS

    BANSAL|Exercise CBSE Question|32 Videos

Similar Questions

Explore conceptually related problems

The displacement-time graph of a moving particle with constant acceleration is shown in. The velocit-time is given by .

Displacement time graph of a particle moving in a straight line is a shown in figure.

The displacement-time graph of a moving particle is shown in the figure. The velocity of the particle is zero at the point ______.

The displacement time graph of a moving particle is shown below The instantaneous velocity of the particle is negative at the point

The displacement-time graph of a particle is as shown below. It indicates that

The displacement-time graph of moving particle is shown below The instantaneous velocity of the particle in negative at the point

The acceleration versus time graph of a particle moving in a straight line is show in. The velocity-time graph of the particle would be .

Velocity displacement graph of a particle moving in a straight line is as shown in figure.

BANSAL-MASTER PRACTICE PROBLEM-Additional topic
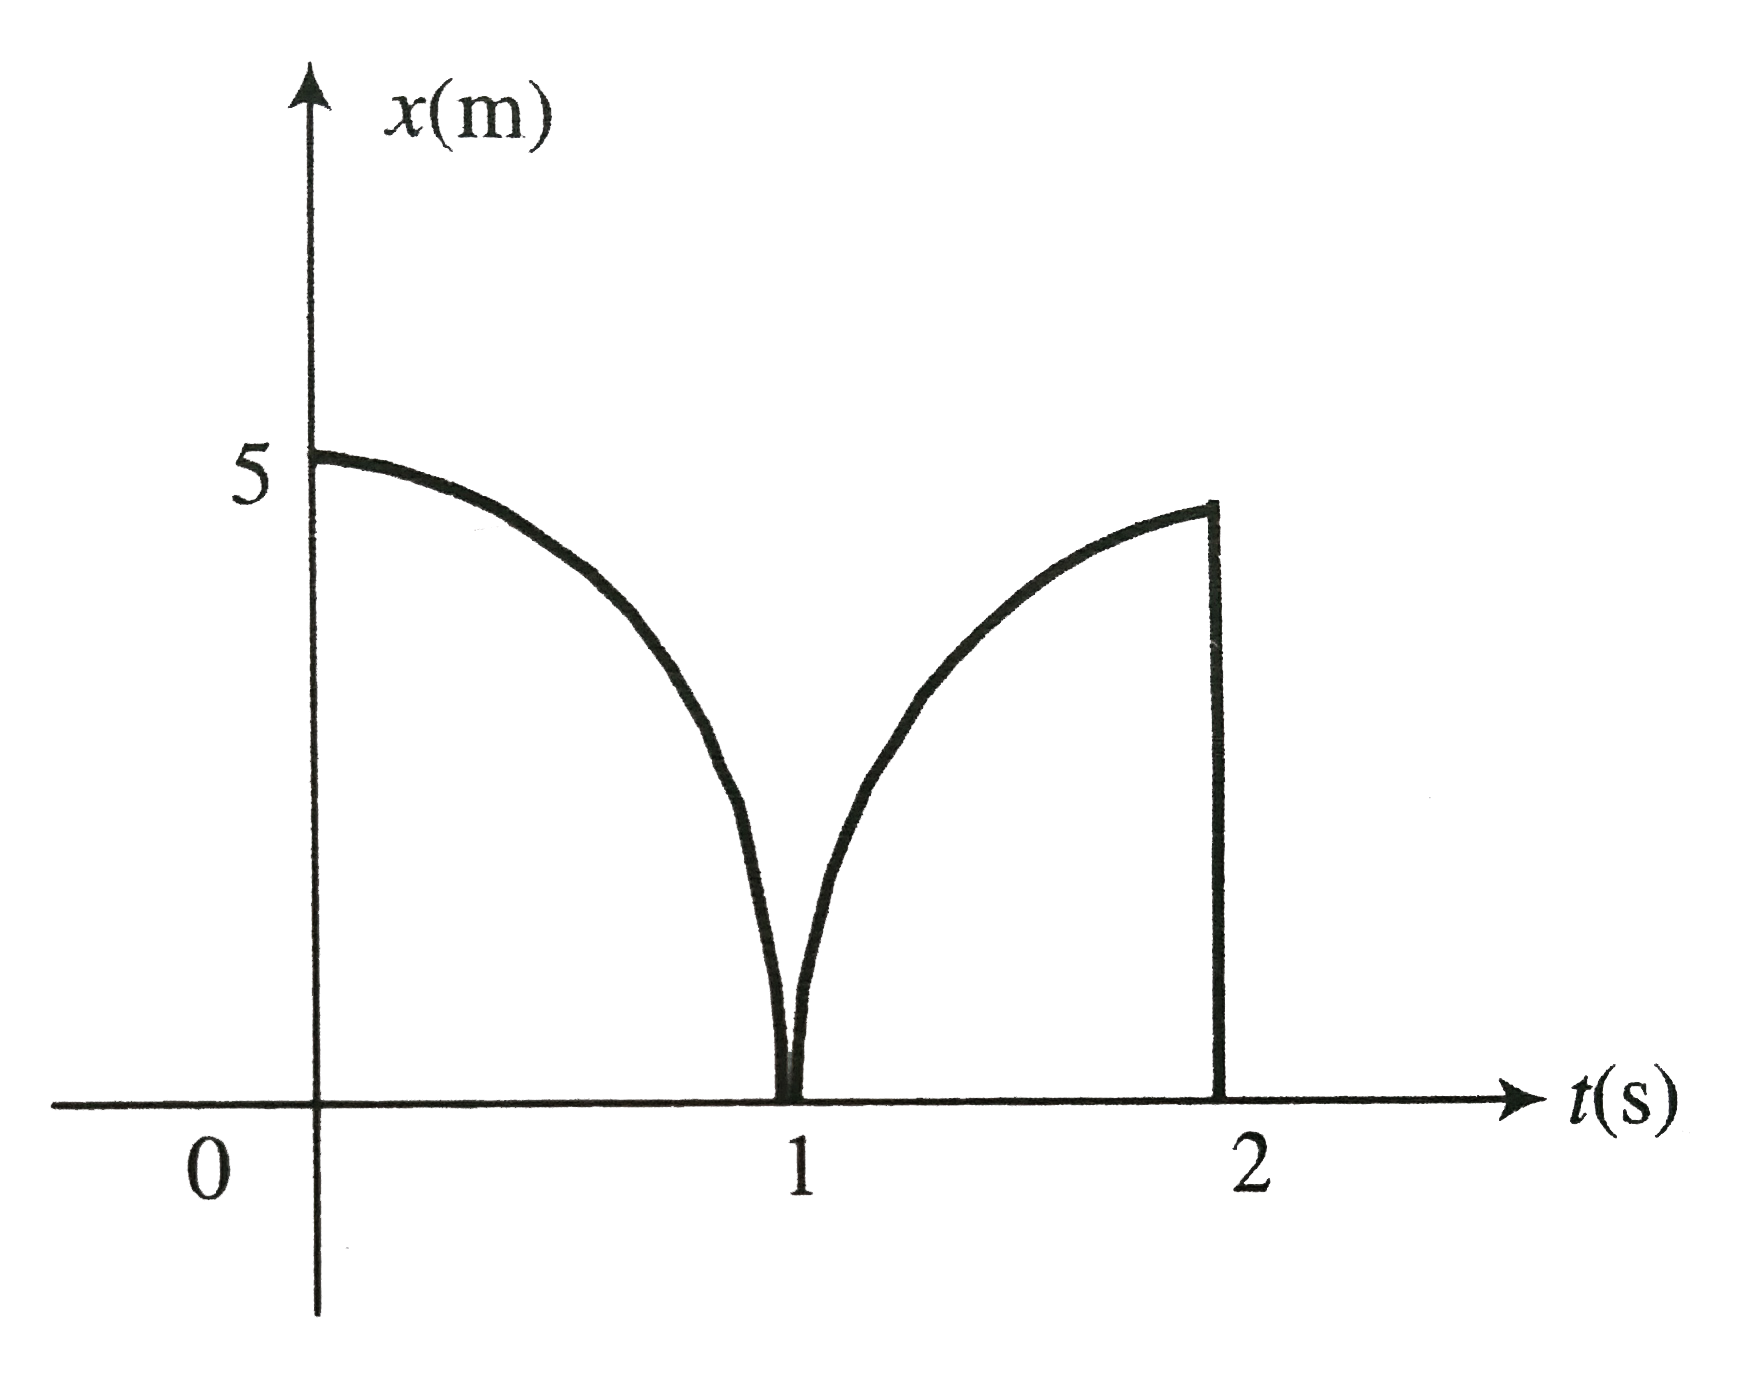
  1. The displacement-time graph of a moving particle with constant acceler...

    Text Solution

    |

  2. The manifestation of band structure in solids is due to

    Text Solution

    |

  3. When p-n junction diode is forward biased then

    Text Solution

    |

  4. If the ratio of the concentration of electron to that of holes in a se...

    Text Solution

    |

  5. If the lattice constant of this semiconductor is decreased, then which...

    Text Solution

    |

  6. In the following, which one of the diodes is reverse biased ?

    Text Solution

    |

  7. The circuit has two oppositively connected ideal diodes in parallel wh...

    Text Solution

    |

  8. If a p-n junction diode, a square input signal of 10 V is applied as s...

    Text Solution

    |

  9. In the circuit below, A and B represents two inputs and C represents t...

    Text Solution

    |

  10. A p-n junction (D) shown in the figure can act as a rectifier. An alte...

    Text Solution

    |

  11. The logic circuit shown below has the input waveforms ‘A’ and ‘B’ as s...

    Text Solution

    |

  12. The combination of gates shown below yields .

    Text Solution

    |

  13. Truth table for system of four NAND gates as shown in figure is : .

    Text Solution

    |

  14. In semiconductor the concentrations of electron and holes are 8xx10^(1...

    Text Solution

    |

  15. A potential difference of 2V is applied between the opposite faces of ...

    Text Solution

    |

  16. The main cause of avalence breakdown is

    Text Solution

    |

  17. A cube of germanium is placed between the poles of a magnet and a volt...

    Text Solution

    |

  18. In the given figure, which of the diodes are forward biased?

    Text Solution

    |

  19. Current in the circuit will be

    Text Solution

    |

  20. The diode used in the circuit shown in the figure has a constant volta...

    Text Solution

    |

  21. In the following circuits PN-junction diodes D(1), D(2) and D(3) are i...

    Text Solution

    |