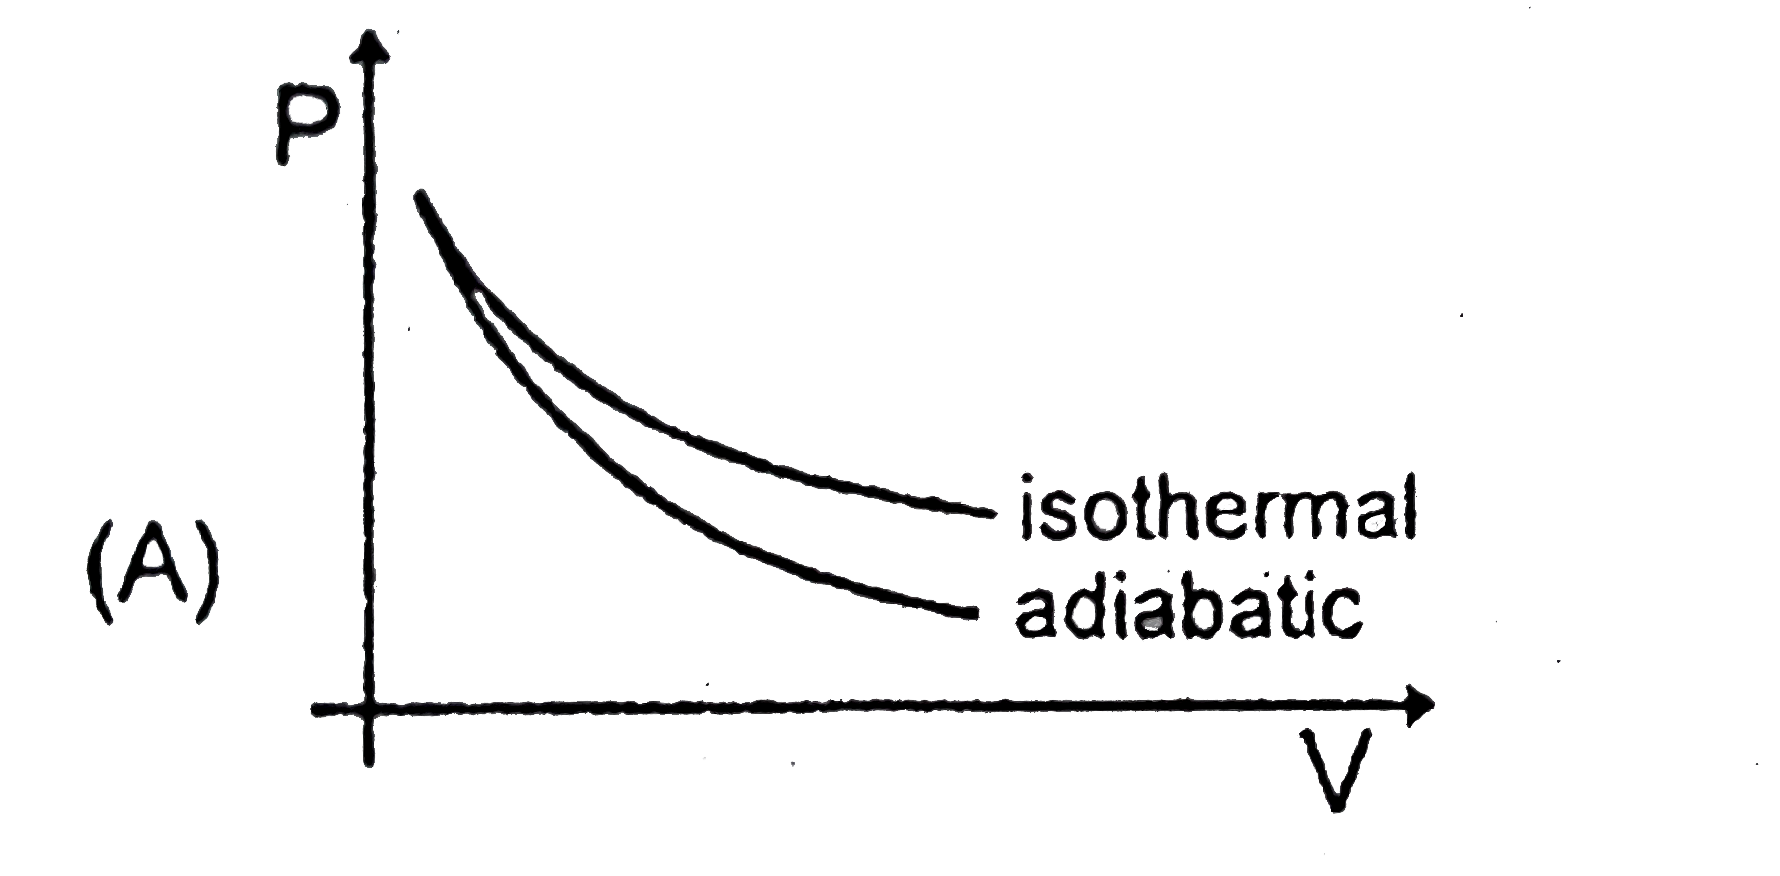
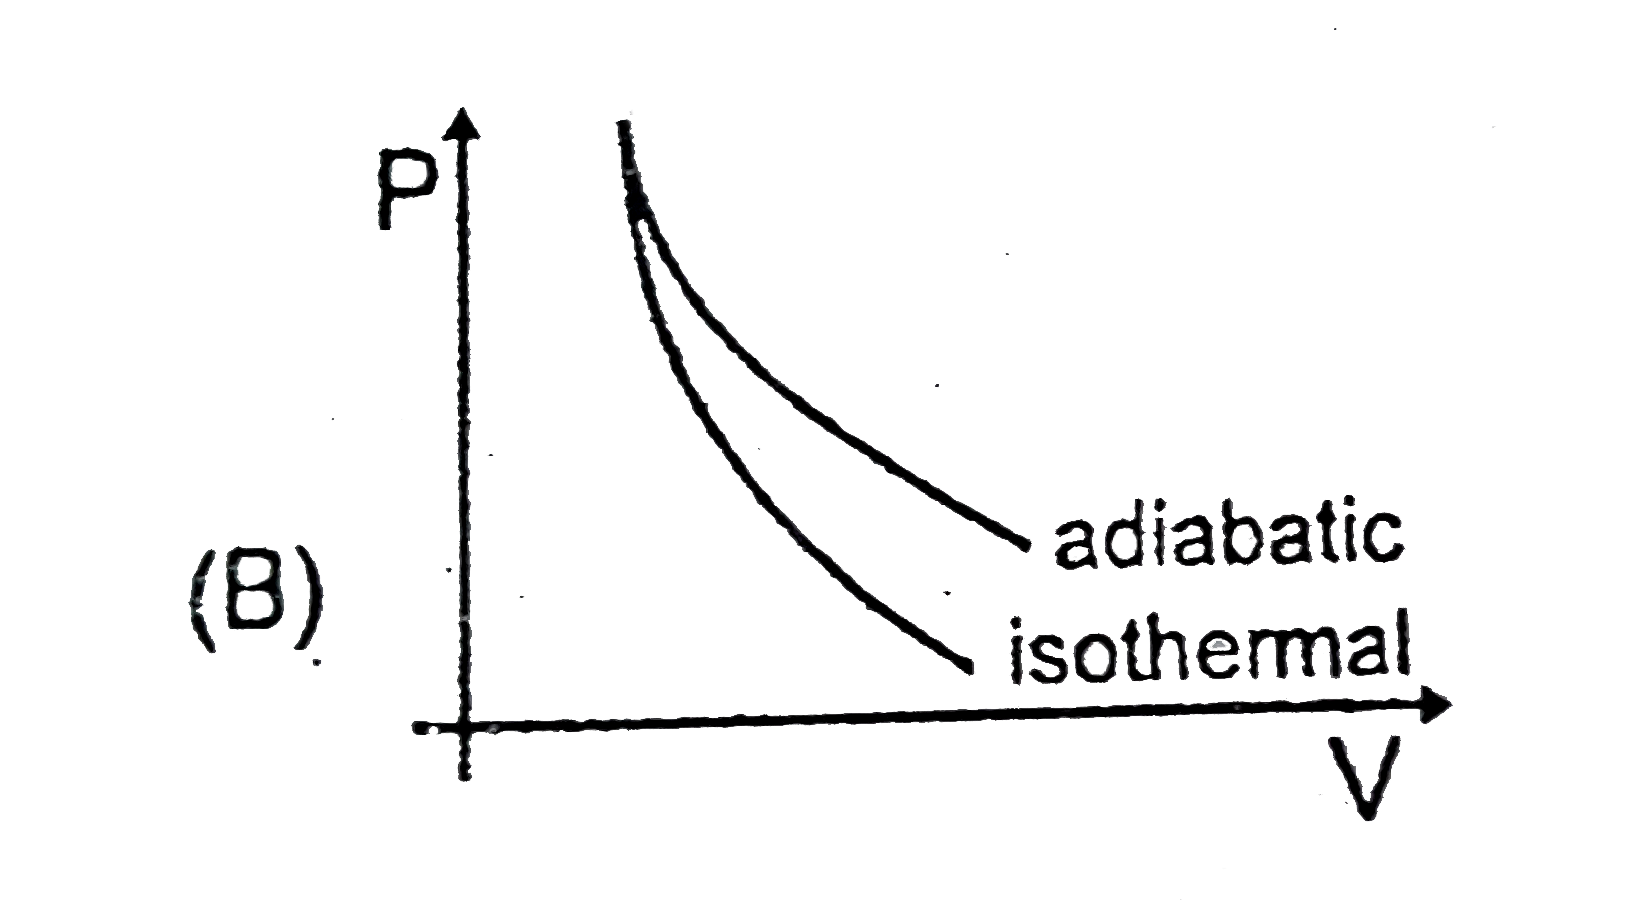
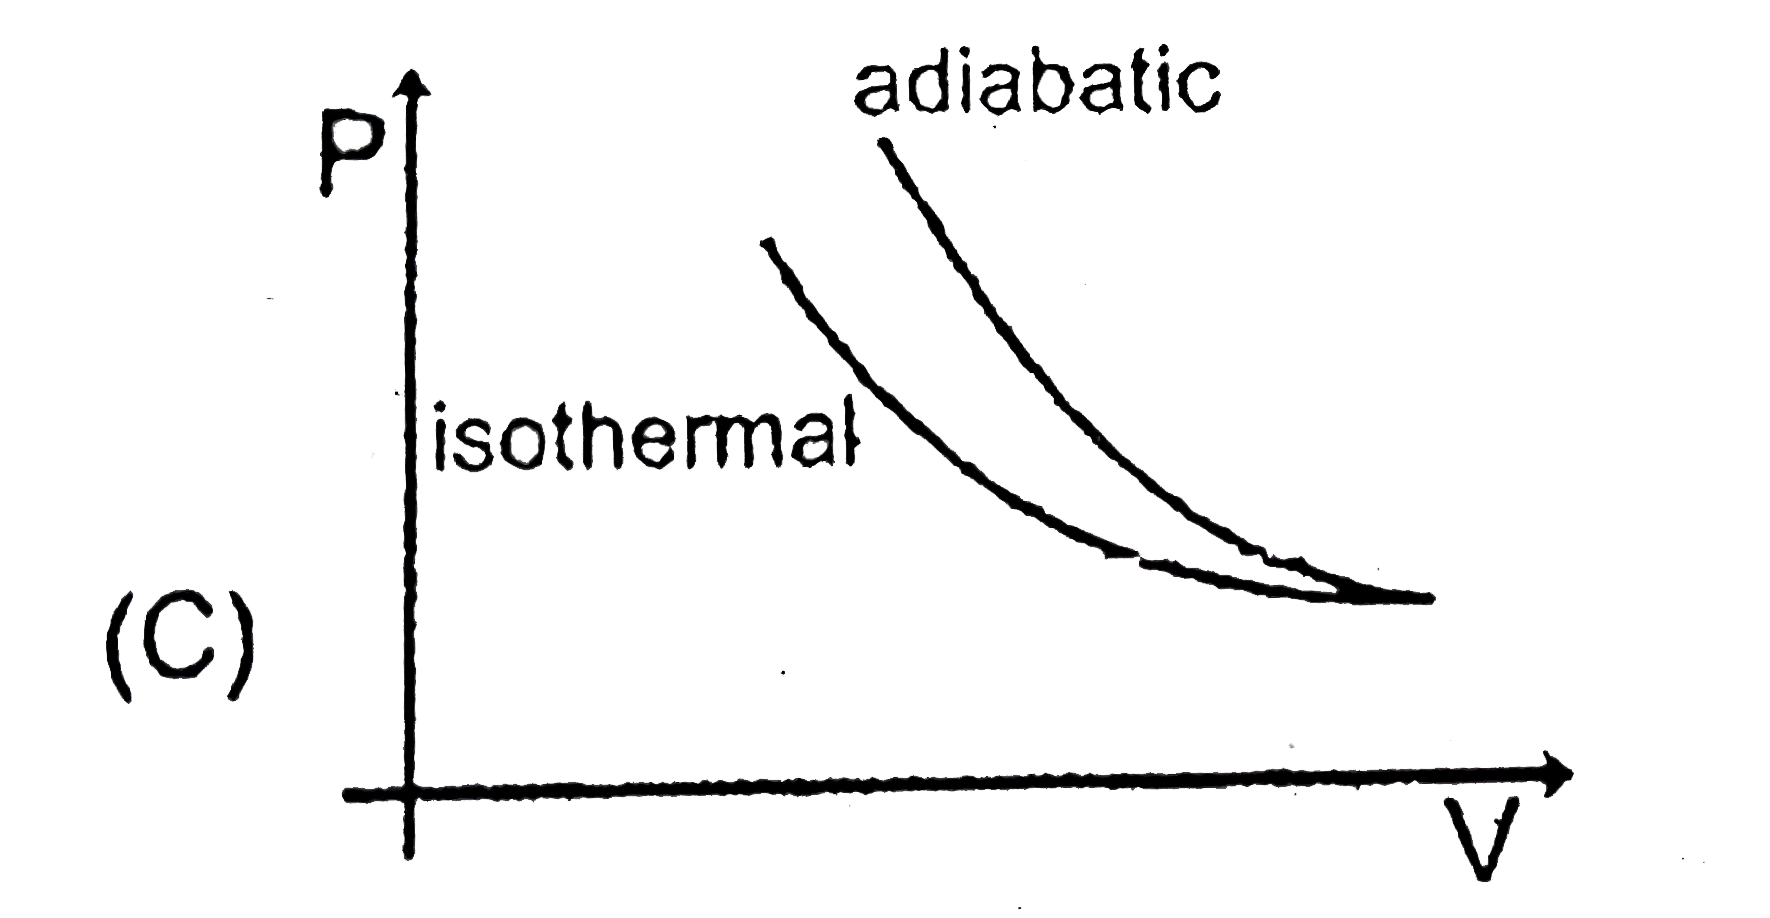
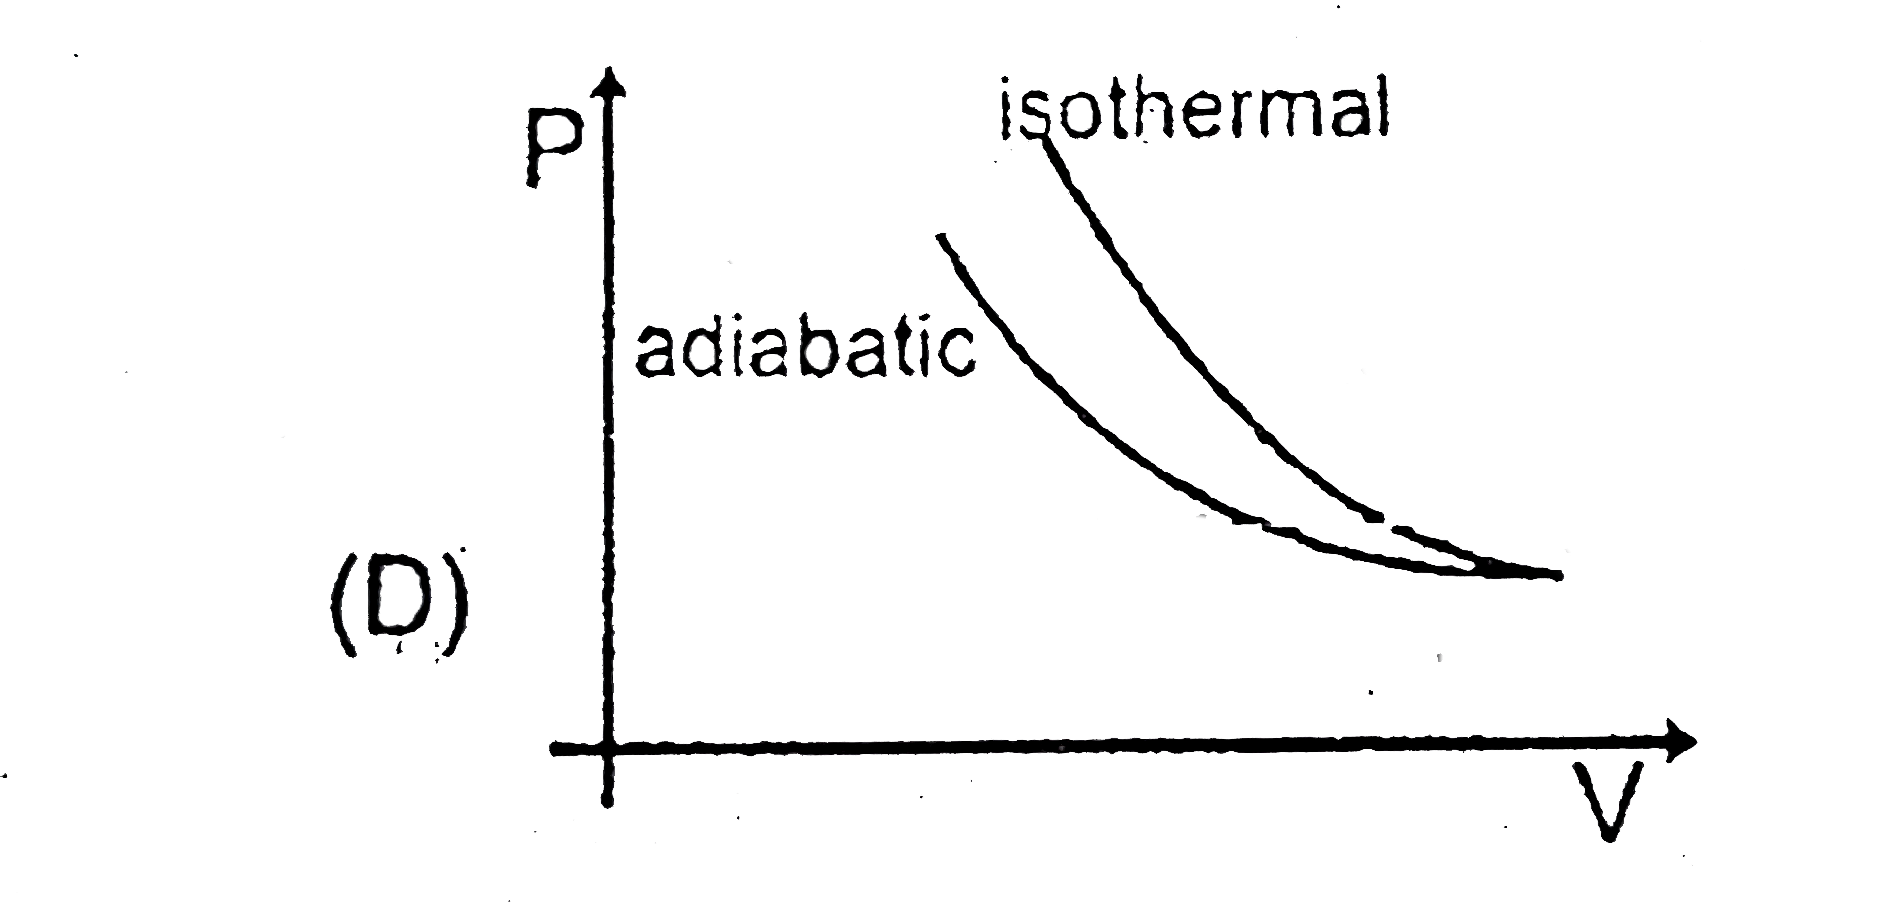
The correct figure representing isothermal and adiabatic compression of an ideal gas from the same initial state is:
A
B
C
D
Text Solution
Verified by Experts
The correct Answer is:
C
Slope of adiabatic curve is greater than isothermal curve.
Topper's Solved these Questions
TEST PAPERS
RESONANCE|Exercise PART - III CHEMISTRY SEC - 1|12 Videos
TEST PAPERS
RESONANCE|Exercise PART - III CHEMISTRY SEC - 2|18 Videos
SURFACE CHEMISTRY
RESONANCE|Exercise Section - 5|1 Videos
TEST SERIES
RESONANCE|Exercise CHEMISTRY|50 Videos
Similar Questions
Explore conceptually related problems
The correct figure representing isothermal and adiabatic expansion of an ideal gas from a particular initial state is:
The correct figure representing isothermal and adiabatic expansions of an ideal gas from a particular initial state is :
In isothermal ideal gas compression
Which of the following statement is incorrect regarding adiabatic and isothermal processes for an ideal gas, starting from same initial state to same final volume?
The combination of plots which does not represent isothermal expansion of an ideal gas is :
The curves A and B in the figure shown P-V graphs for an isothermal and an adiabatic process for an idea gas. The isothermal process is represented by the curve A.
Select the correct statement for isothermal expansion of an ideal gas
Curve in the figure shows an adiabatic compression of an ideal gas from 15m^3 to 12m^3 , followed by an isothermal compression to a final volume of 3.0m^3 . There are 2.0 moles of the gas. Total heat supplied to the gas is equal to: (ln2= 0.693)