A
B

C
D
Text Solution
Verified by Experts
The correct Answer is:


Topper's Solved these Questions
Similar Questions
Explore conceptually related problems
GRB PUBLICATION-GRAPHICAL INTERPRETATION-Subjective Type
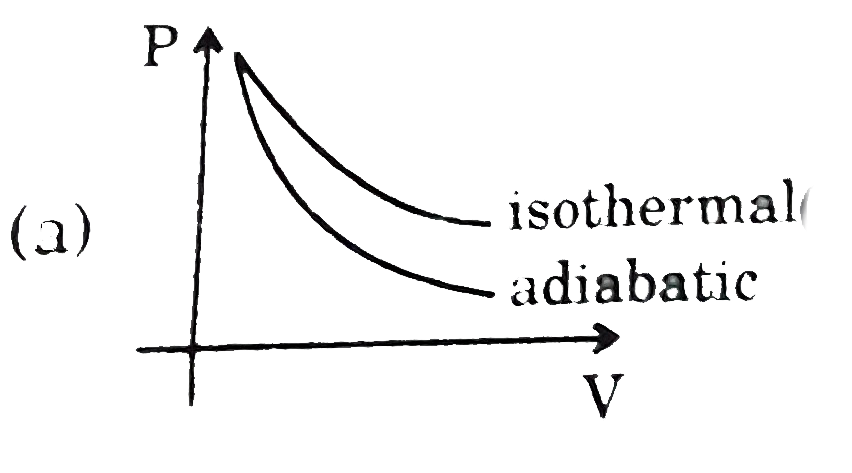
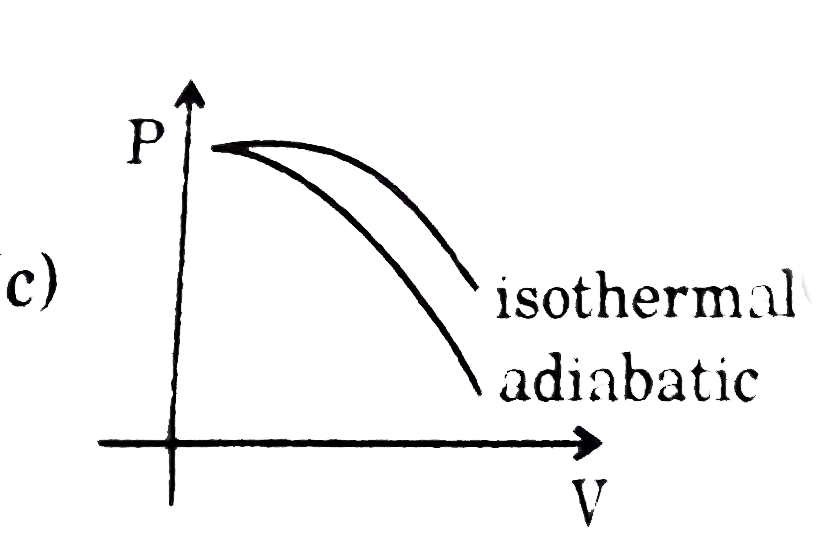
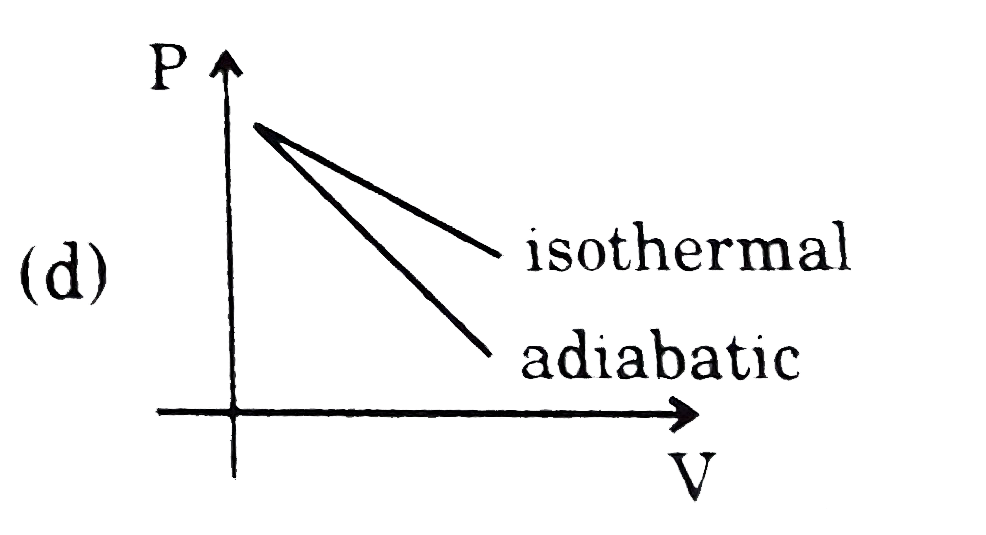
- The correct figure representing isothermal and adiabatic expansion of ...
Text Solution
|
- For adsorption of a gas on solid surface, following isotherm was obtai...
Text Solution
|
- From the following graph of log x//m us log P, calculate mass of H(@) ...
Text Solution
|
- Calculate magnitude of work involved in the reversible cyclic process ...
Text Solution
|
- From the graph of (d)/(P) us P at a constant temperature of 300 K. cal...
Text Solution
|
- For adsorption of gas over solid surface following data is obtained at...
Text Solution
|
- For a fixed amount of a real gas when a graph of Z us P was plotted th...
Text Solution
|
- 10 moles of an ideal gas is subjected to an isochoric process (volume ...
Text Solution
|
- For O(2) gas at T(1) and T(2) following Maxwell speed distribution is ...
Text Solution
|
- Two moles of an ideal gas undergoes the process depicted below. Given ...
Text Solution
|
- One mole of an ideal gas is subjected to a two step reversible process...
Text Solution
|
- Calculate DeltaG (in L atm) from the graph of an ideal gas undergoing ...
Text Solution
|
- One mole of an ideal monoatomic gas undergoes the following cyclic pro...
Text Solution
|
- One mole of a monoatomic ideal gas is taken through a cycle ABCDA as s...
Text Solution
|
- One mole of a gas is taken from state A to state B as shown in figure....
Text Solution
|
- One mole of an ideal monoatomic gas is heated according to path AB and...
Text Solution
|
- Find the heat absorbed by an ideal gas (in kJ)w it follows the graph (...
Text Solution
|
- If work done by an ideal gas in process 1-2 on the given graph is 0.4 ...
Text Solution
|
- Between two isotherms we have a cycle as shown. Find the work done by ...
Text Solution
|
- Calculate magnitude of net work in following cyclic process for 1 mole...
Text Solution
|
- One mole of monoatomic gas taken through a cyclic process as shown in ...
Text Solution
|