A
B
C
D
Text Solution
Verified by Experts
The correct Answer is:


Topper's Solved these Questions
GRAPHICAL INTERPRETATION
GRB PUBLICATION|Exercise B. Gaseous State|1 VideosGRAPHICAL INTERPRETATION
GRB PUBLICATION|Exercise Gaseous State|39 VideosGRAPHICAL INTERPRETATION
GRB PUBLICATION|Exercise Subjective Type|23 VideosF-BLOCK ELEMENTS
GRB PUBLICATION|Exercise Subjective type|7 VideosHYDROCARBON (ALIPHATIC)
GRB PUBLICATION|Exercise Previous years jee questions|28 Videos
Similar Questions
Explore conceptually related problems
GRB PUBLICATION-GRAPHICAL INTERPRETATION-Thermodynamics
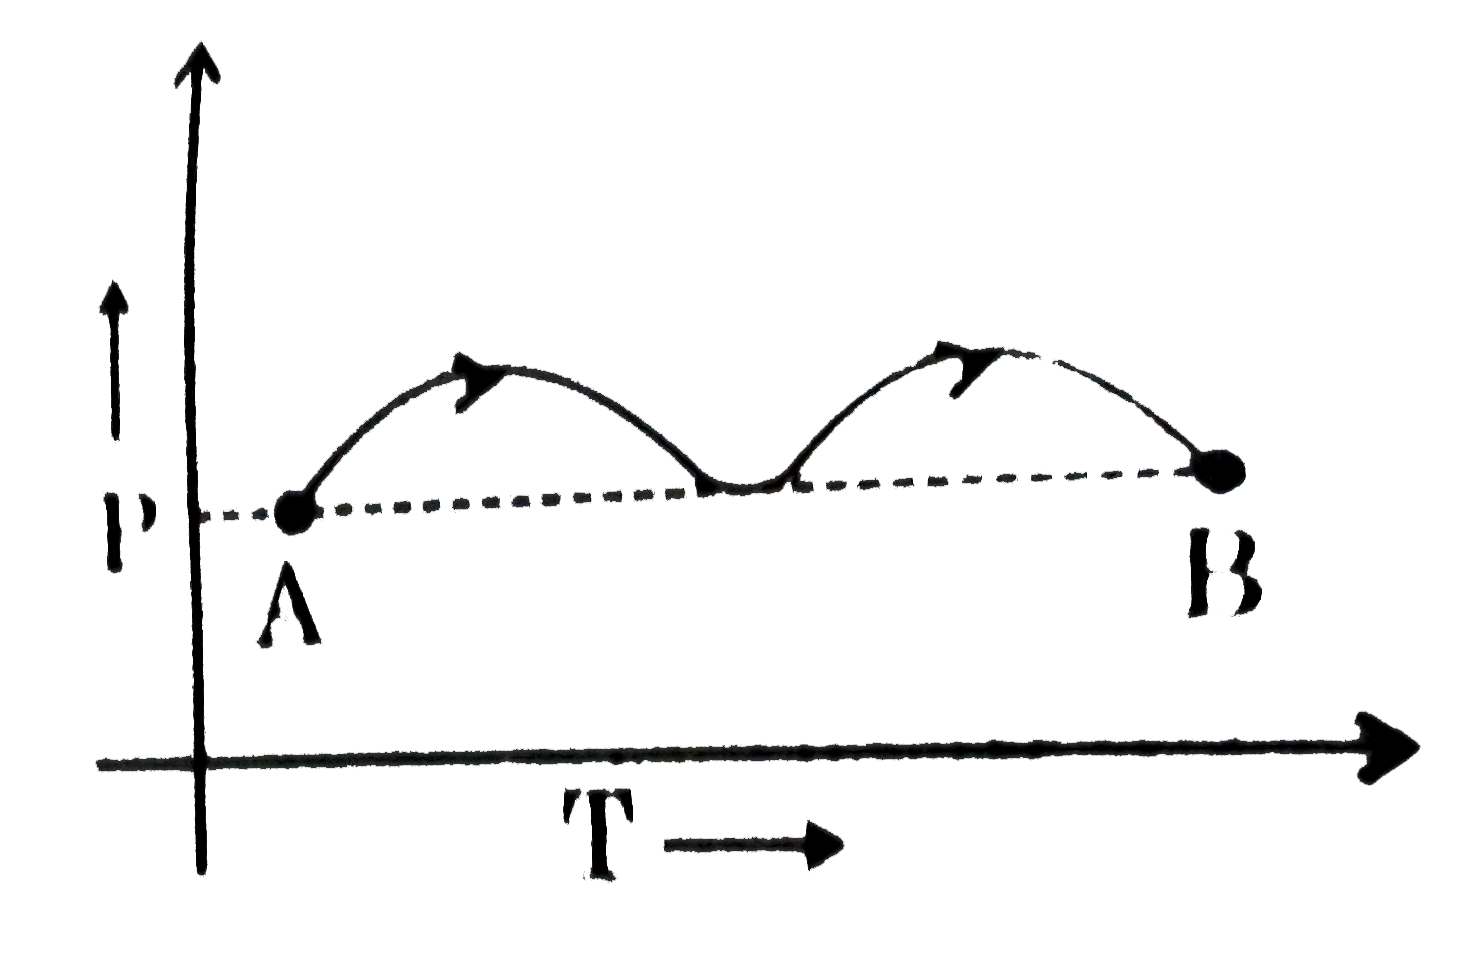
- For 1 mol of an ideal gas work in process AB will be:
Text Solution
|
- An ideal gas which has gamma = 4//3 is taken from A to B according to ...
Text Solution
|
- The P-T graph, as given below, was observed for a process on an ideal ...
Text Solution
|
- One mole of an ideal gas is undergoing process as shown in figure then...
Text Solution
|
- In given cyclic process for an ideal gas Path B rarr C is isoentr...
Text Solution
|
- For an ideal gas four processes are marked as 1,2,3 and 4 on P-V diagr...
Text Solution
|
- Consider the cyclic process R rarr S rarr R as shown in the fig. You a...
Text Solution
|
- An ideal gas is taken from the same initial pressure P(1) to the same ...
Text Solution
|
- If the plot 1 rarr 2 represents an infinite stage adiabatic process an...
Text Solution
|
- Which of the following graph correctly represents variation of P vs V ...
Text Solution
|
- A substance is subjected to a four step reversible process ABCD as sho...
Text Solution
|
- For 1 mole of an ideal gas, a graph of pressure vs volume is plotted a...
Text Solution
|
- A reversible cyclic process is represented as shown. The efficiency of...
Text Solution
|
- Calculate magnitude of work done in calorie for one mole of an ideal g...
Text Solution
|
- An ideal gas in subjected to a three step reversible process as shown....
Text Solution
|
- In an experiment to determine the enthalpy of neutralisation of sodium...
Text Solution
|
- Chemicals A and B each initially at 20^(@)C react exothermically. A gr...
Text Solution
|
- An ideal gas is subjected to various changes which are plotted as foll...
Text Solution
|
- A thermodynamic process is shown in the following figure. In the proce...
Text Solution
|
- Which of the following graph is correct reversible adiabatic process f...
Text Solution
|