A
B
C
D
Text Solution
Verified by Experts
The correct Answer is:


Topper's Solved these Questions
GRAPHICAL INTERPRETATION
GRB PUBLICATION|Exercise C. Atomic Sturcture|1 VideosGRAPHICAL INTERPRETATION
GRB PUBLICATION|Exercise Atomic Sturcture|9 VideosGRAPHICAL INTERPRETATION
GRB PUBLICATION|Exercise B. Gaseous State|1 VideosF-BLOCK ELEMENTS
GRB PUBLICATION|Exercise Subjective type|7 VideosHYDROCARBON (ALIPHATIC)
GRB PUBLICATION|Exercise Previous years jee questions|28 Videos
Similar Questions
Explore conceptually related problems
GRB PUBLICATION-GRAPHICAL INTERPRETATION-Gaseous State
- Which graph represents the correct relationship between various veloci...
Text Solution
|
- Pressure versus temperature graph of an ideal gas of equal number of m...
Text Solution
|
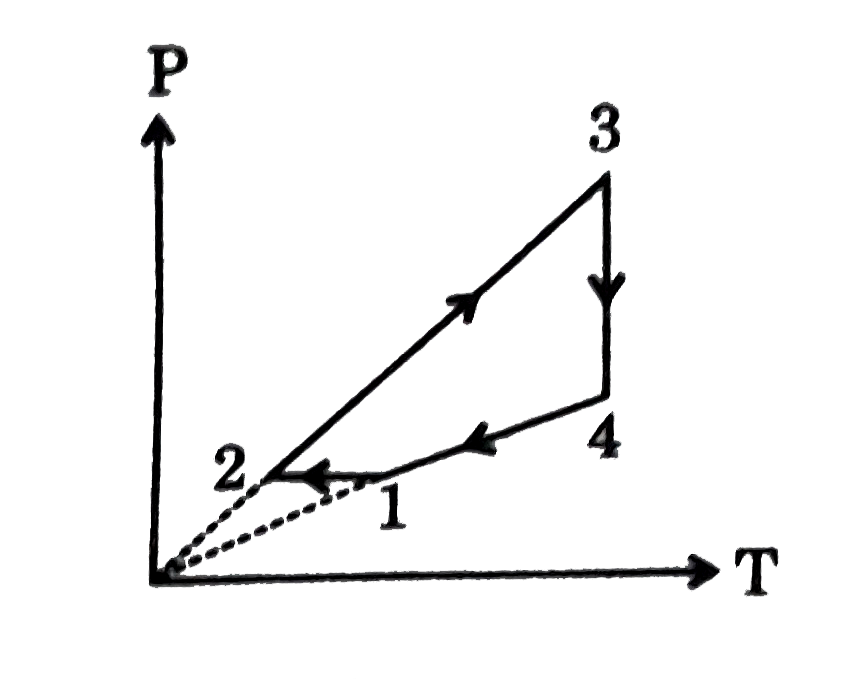
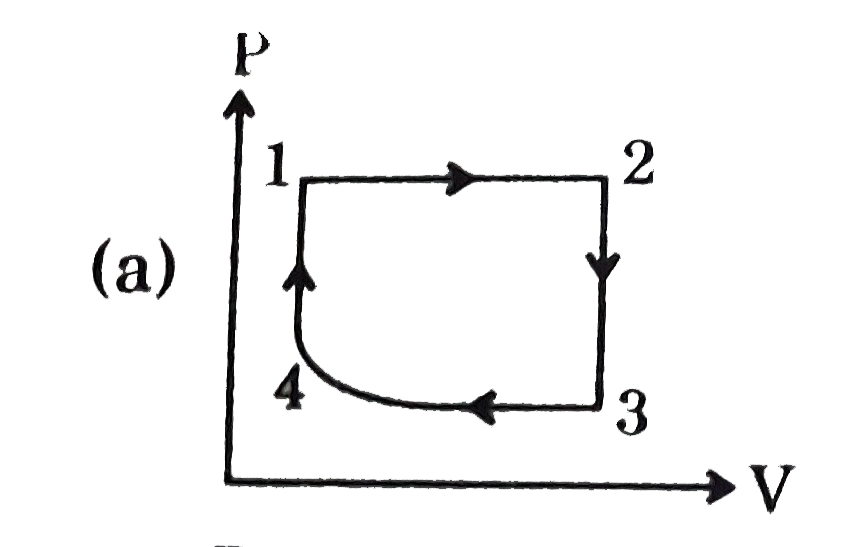
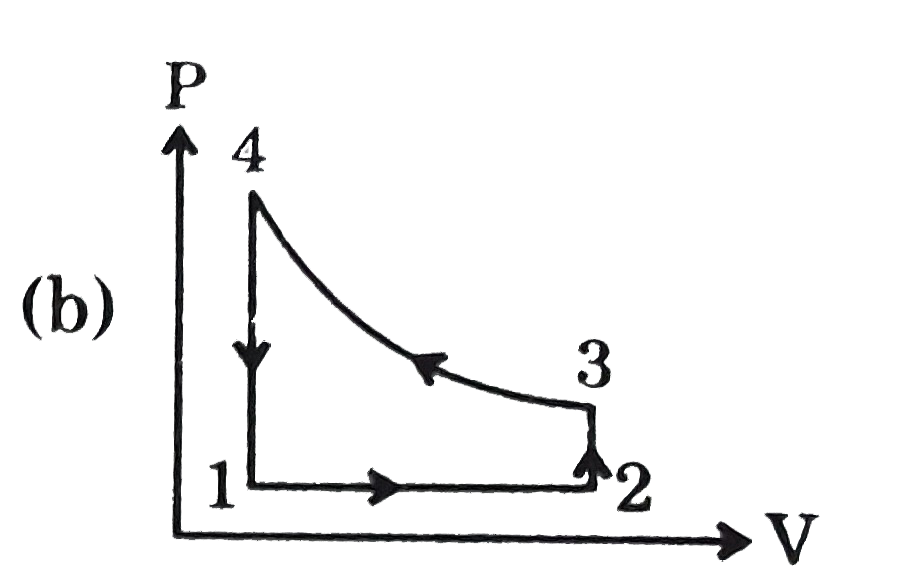
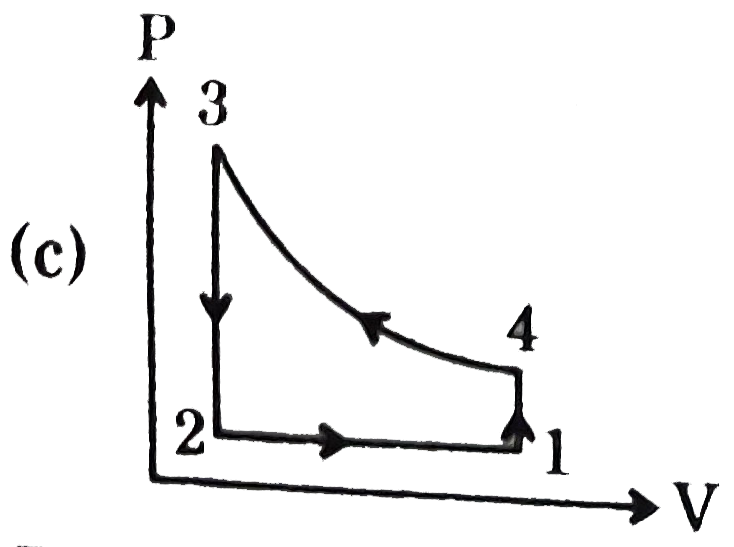
- Consider the following (P-T) graph for a fixed mass of gas: Correct P-...
Text Solution
|
- For the given isotherm (P in atm and V in L) for one mole of an ideal ...
Text Solution
|
- Graph depicting correct behaviour of ideal gas and H(2) gas will be (n...
Text Solution
|
- During decomposition of NH(2)COONH(2)(s) reaction: NH(2) COONH(4)(s) r...
Text Solution
|
- For an ideal gas kept in a container attached manometer as show. Find ...
Text Solution
|
- Which of the following graphs is inconsistent with ideal gas behaviour...
Text Solution
|
- Which one of these graphs for an ideal gas havinga fixed amount, the a...
Text Solution
|
- Consider the given graph: Graph is plotted for 1 mol of gas at 400K, f...
Text Solution
|
- The pressure P of a gas is plotted against its absolute temperature T ...
Text Solution
|
- P us V curves were plotted for three different samples containing same...
Text Solution
|
- For ideal gas, observation as per Maxwell distribution
Text Solution
|
- In the given curve total area under the graph represents:
Text Solution
|
- Which graph is not a straight line for an ideal gas ?
Text Solution
|
- Consider the following statements. (a) An oleum sample can be label...
Text Solution
|
- Z us P graph is plotted for 1 mole of hypothetical gas. Volume of gas ...
Text Solution
|
- In the given isobaric process shown by graph between T and V.
Text Solution
|
- For the below graph which of the following combination is correct, (n ...
Text Solution
|
- A cyclic process ABCD is shown in VT diagram for an ideal gas. Which o...
Text Solution
|