A
B
C
D
Text Solution
Verified by Experts
The correct Answer is:


Topper's Solved these Questions
GRAPHICAL INTERPRETATION
GRB PUBLICATION|Exercise C. Atomic Sturcture|1 VideosGRAPHICAL INTERPRETATION
GRB PUBLICATION|Exercise Atomic Sturcture|9 VideosGRAPHICAL INTERPRETATION
GRB PUBLICATION|Exercise B. Gaseous State|1 VideosF-BLOCK ELEMENTS
GRB PUBLICATION|Exercise Subjective type|7 VideosHYDROCARBON (ALIPHATIC)
GRB PUBLICATION|Exercise Previous years jee questions|28 Videos
Similar Questions
Explore conceptually related problems
GRB PUBLICATION-GRAPHICAL INTERPRETATION-Gaseous State
- For the below graph which of the following combination is correct, (n ...
Text Solution
|
- A cyclic process ABCD is shown in VT diagram for an ideal gas. Which o...
Text Solution
|
- A gas is taken isochorically from state A to state C as shown in the g...
Text Solution
|
- At 273 K, Pd vs P is plotted for various gases 1,2,3,4 assuming ideal ...
Text Solution
|
- If the above plot is replotted at 373 K, then which of the following p...
Text Solution
|
- The product of PV is plotted against P at two temperatures T(1) and T(...
Text Solution
|
- The graphs representing distribution of molecular speeds at 300 K for ...
Text Solution
|
- For a fixed amount of an ideal gas P us T plot is given as shown. Iden...
Text Solution
|
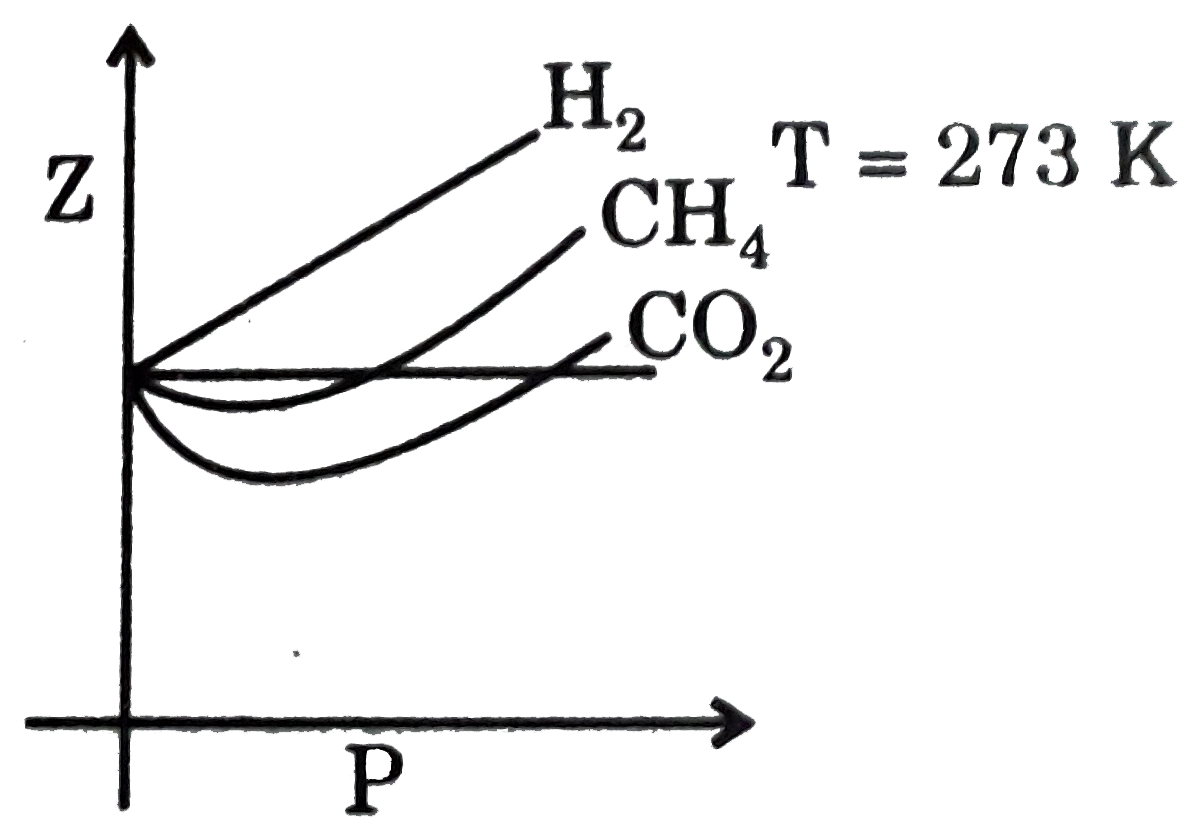
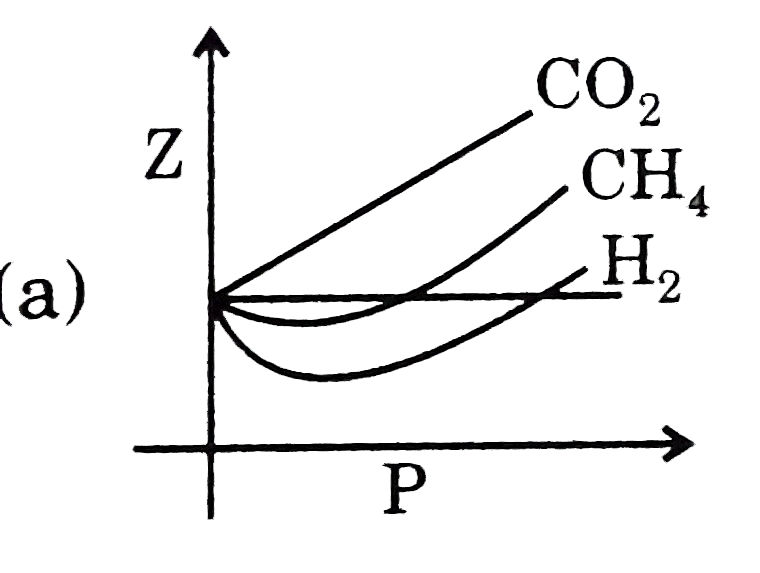
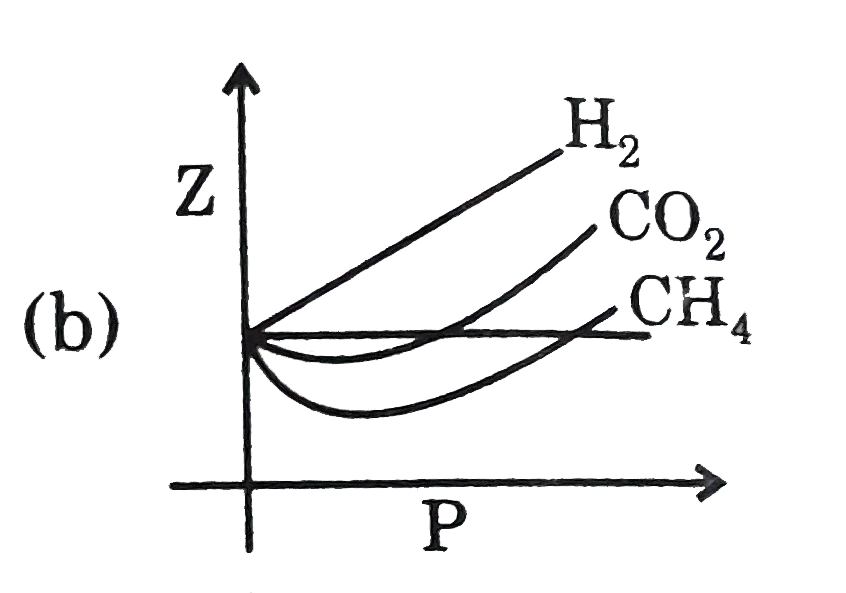
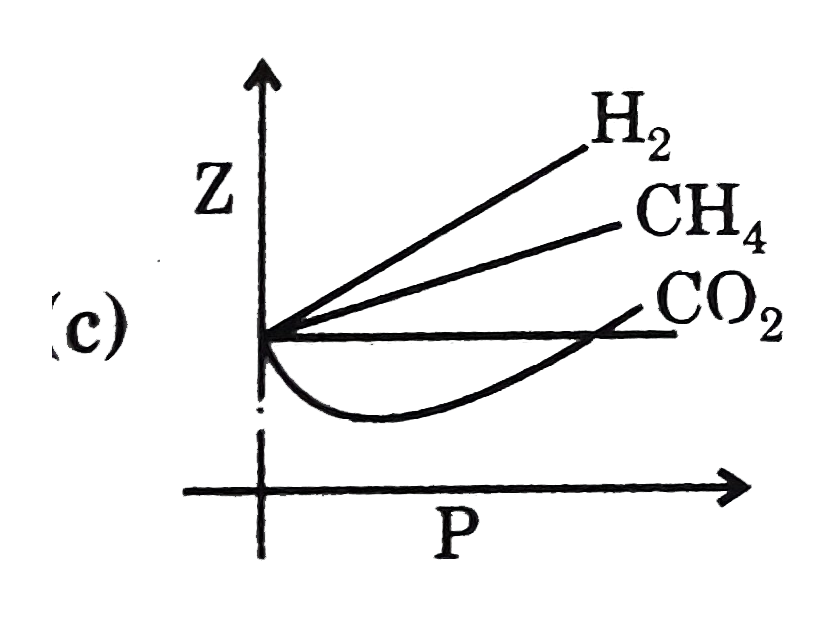
- Which of the following options correctly match the graph of Z us P at ...
Text Solution
|
- Following graphs are obtained when different gases are subjected to ch...
Text Solution
|
- I,II,III are three isotherms respectively at T(1),T(2) and T(3) for a ...
Text Solution
|
- The curve of pressure volume (PV) against pressure (P) of the gas at a...
Text Solution
|
- For one mole of a van der Waal's gas when b = 0 and T = 300K, the PV u...
Text Solution
|
- For a real gas the P-V curve was experimentally plotted and it had the...
Text Solution
|
- The curve in the accompanying diagram represent the PV//RT behaviour o...
Text Solution
|
- Gas A (1 mol) dissociates in a closed rigid container of volume 0.16 l...
Text Solution
|
- Which of following graphs correctly represent variation of alpha = (-(...
Text Solution
|
- Which of the following volume-temperature (V-I) plots represents the b...
Text Solution
|
- Select the incorrect statements on the basis of curve given below for ...
Text Solution
|
- For the given plot, match the most appropriate graph for respective ga...
Text Solution
|