Home
Class 12
MATHS
Population of Greenleaf, Idaho The...

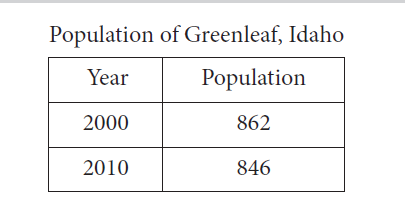
Population of Greenleaf, Idaho

The table above shows the population of Greenleaf, Idaho, for the years 2000 and 2010. If the relationship between population and year is linear, which of the following functions P models the population of Greenleaf t years after 2000?

A

P(t) = 862 − 1.6t

B

P(t) = 862 − 16t

C

P(t) = 862 + 16(t − 2,000)

D

P(t) = 862 − 1.6(t − 2,000)

Text Solution

Verified by Experts

The correct Answer is:
A

It is given that the relationship between population and year is linear, therefore, the function that models the population t years after 2000 is of the form P (t) = mt + b, where m is the slope and b is the population when t = 0. In the year 2000, t = 0. Therefore, b = 862. The slope is given by `m=(P(10)-P(0))/(10-0)=(846-862)/(10-0)=(-16)/10=-1.6`. Therefore ,P(t)=-1.6t+862, which is equivalent to the equation in choice A.
Choice B is incorrect and may be the result of incorrectly calculating the slope as just the change in the value of P. Choice C is incorrect and may be the result of the same error as in choice B, in addition to incorrectly using t to represent the year, instead of the number of years after 2000. Choice D is incorrect and may be the result of incorrectly using t to represent the year instead of the number of years after 2000.
Promotional Banner

Similar Questions

Explore conceptually related problems

The population, p of a town can be modeled by the equation P=750(1.15)^(d) , where d is the number of decades after the year 1980. Which of the following equations can be used to model the population of the town y years after 1980?

Consider the following population and year graph: find the slope of the line AB and using it find what will be the population in the year 2010.

The population of a town increases by 10% annually. If the present population is 60000, what will be its population after 2 years?

The table above shows the population growth of certain bacteria over four seconds. Which one of the following equations shows the relationship between t and p, according to the table?

The graph above shows the size of a certain population after time t. Which of the following equations correctly shows y as a function of t ?

On January 1, 2015, a family living on an island releases their two pet rabbits into the wild. Due to the short gestation period of rabbits, and the fact that the rabbit population doubles each month. If p represents the rabbit population t years after January 1, 2015, then which of the following equations best models the rabbit population on this island over time?

A radioactive substance decays at an annual rate of 13 percent. If the initial amount of the substance is 325 grams, which of the following functions f models the remaining amount of the substance, in grams, t years later?

In planning maintenance for a city’s infrastructure, a civil engineer estimates that, starting from the present, the population of the city will decrease by 10 percent every 20 years. If the present population of the city is 50,000, which of the following expressions represents the engineer’s estimate of the population of the city t years from now?

The population of a city was 20,000 in the year 1997. It increased at the rate of 5% p.a. Find the population at the end of the year 2000.

The population of a town increases by 20% in each year starting 2010. If the total population of the two in 2013 is 77940, what was the population of the town is 2010?