Text Solution
Verified by Experts
The correct Answer is:


Topper's Solved these Questions
Similar Questions
Explore conceptually related problems
SL ARORA-MOTION IN ONE DIMENSION-problems for self practice
- A stone is dropped from the top of a tower 200 m high. At the same tim...
Text Solution
|
- A body is dropped from the top a towar 150 m, and sumultaneously, anot...
Text Solution
|
- A body falling freely under gravity passes two points 30 m apart in ...
Text Solution
|
- A stone is dropped from the top of tall tower and one second later ano...
Text Solution
|
- A parachutist after bailing out falls 50 m ,whitout friction. When the...
Text Solution
|
- A body falling freely from rest from the top of a tower describes 60.1...
Text Solution
|
- A stone is dropped from a balloon at an altitude of '300 m'. How ling...
Text Solution
|
- four balls are dropped from the top of a tower at intervals of one - ...
Text Solution
|
- A particle moves along X-axis in such a way that its coordinate X vari...
Text Solution
|
- The displacement of a particle along the x-axis is given by x=3+8t+7t^...
Text Solution
|
- the distance traversed by a particle moving along a stranigt line is g...
Text Solution
|
- Shows the position-time graphs of three cars A,B and C On the basis of...
Text Solution
|
- An insect crawling up a wall crawls 3 cm upwords in the first minute ...
Text Solution
|
- a driver of a car travelling at 52 km//h applies the brakes and accele...
Text Solution
|
- starting form rest a cars moves with unifrom acceleration and attia...
Text Solution
|
- fig 3.36 showns the velocity time graph of a rocket projeted upwards...
Text Solution
|
- A motor car, starting from rest, moves with uniform acceleration and a...
Text Solution
|
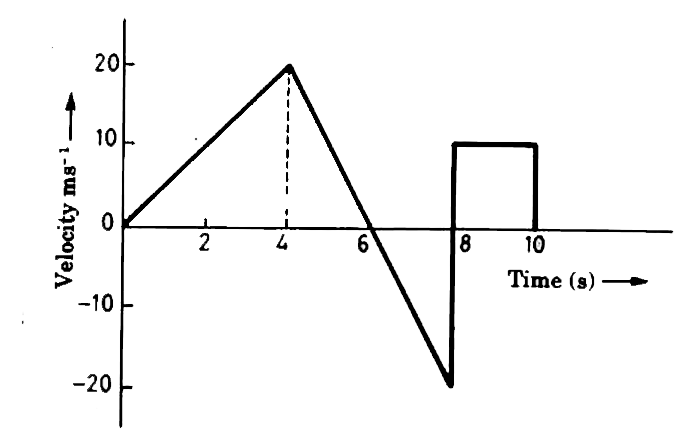
- The velocity-time graph of an object moving along a straight line is a...
Text Solution
|
- As soon as a car just starts from rest in a certain direction, a scoot...
Text Solution
|
- Fig. 3.39 shows the acceleration - time graph for a particle in rectil...
Text Solution
|