A
B
C
D

Text Solution
AI Generated Solution
The correct Answer is:


Topper's Solved these Questions
Similar Questions
Explore conceptually related problems
ENGLISH SAT-HEART OF ALGEBRA -PRACTICE TEST
- The distance d, in mills , that an object travels at a uniform speed i...
Text Solution
|
- In the diagram above , A and D are points on the x-axis . Point A has ...
Text Solution
|
- The lines shown in the above diagram have equations x-y=3 and 3x+2y=6....
Text Solution
|
- Carol downloads x songs at 99 cents each , and y e-books at $2.99 each...
Text Solution
|
- If k is a positive constant such that 0 lt k lt 1, which of the follow...
Text Solution
|
- 1/2x - 1/4y = 5 ,ax - 3y = 20 In the system of linear equations abov...
Text Solution
|
- 3x+2y=6 y-2x=24 Based on the system of equations above , what is ...
Text Solution
|
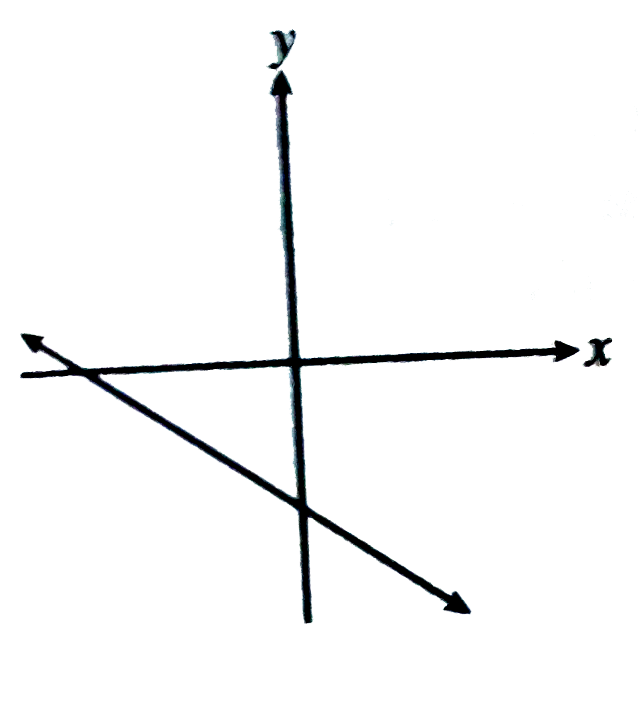
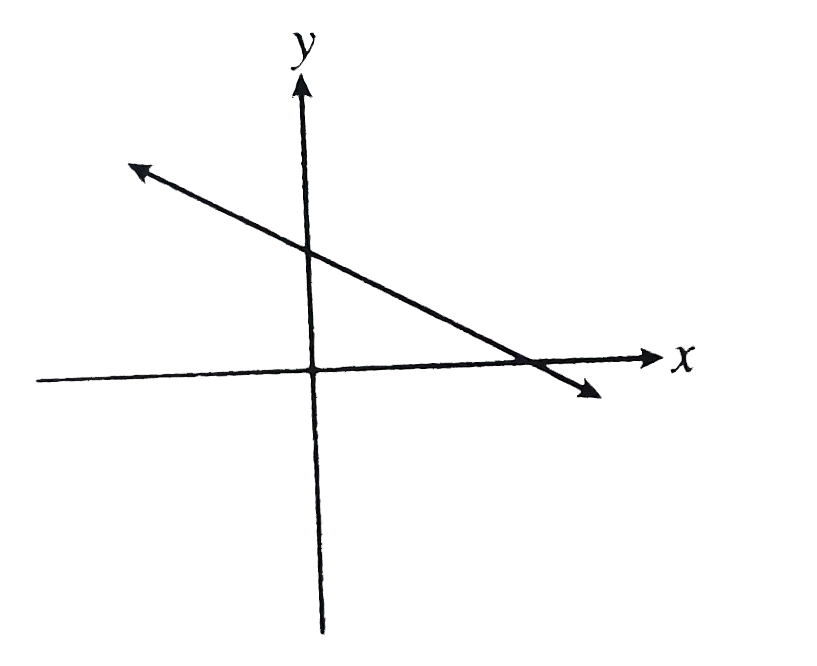
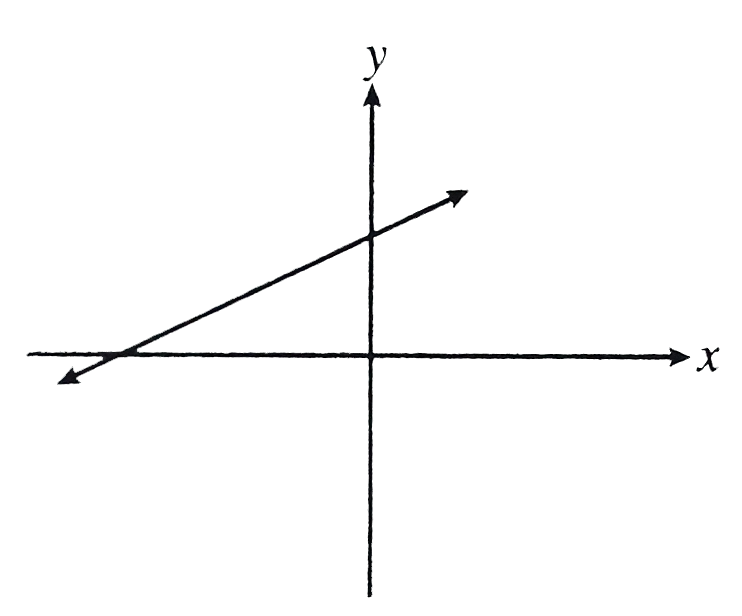
- Which of the following could be the graph of 2x+3y+12=0 ?
Text Solution
|
- The number of mudslides in a certain country for the past 25 years is ...
Text Solution
|
- Tickets to a show are $150 each plus 8 percent sales tax. There is als...
Text Solution
|
- (2(p+3)-7)/4=(16-2(3-p))/6 In the equation above , what is the value...
Text Solution
|
- If 1/5x-2/3y=4. What is the value of 3x-10y ?
Text Solution
|
- If -9/5 lt -5t +2 lt -7/4 . What is one possible value of 10t-4 ?
Text Solution
|
- The graph of 3x-4y=5 is perpendicular to the graph of 2x+ky-10=0. Find...
Text Solution
|