A
B
C
D
Text Solution
Verified by Experts
The correct Answer is:


Topper's Solved these Questions
Similar Questions
Explore conceptually related problems
DC PANDEY-RAY OPTICS-Integer type q.
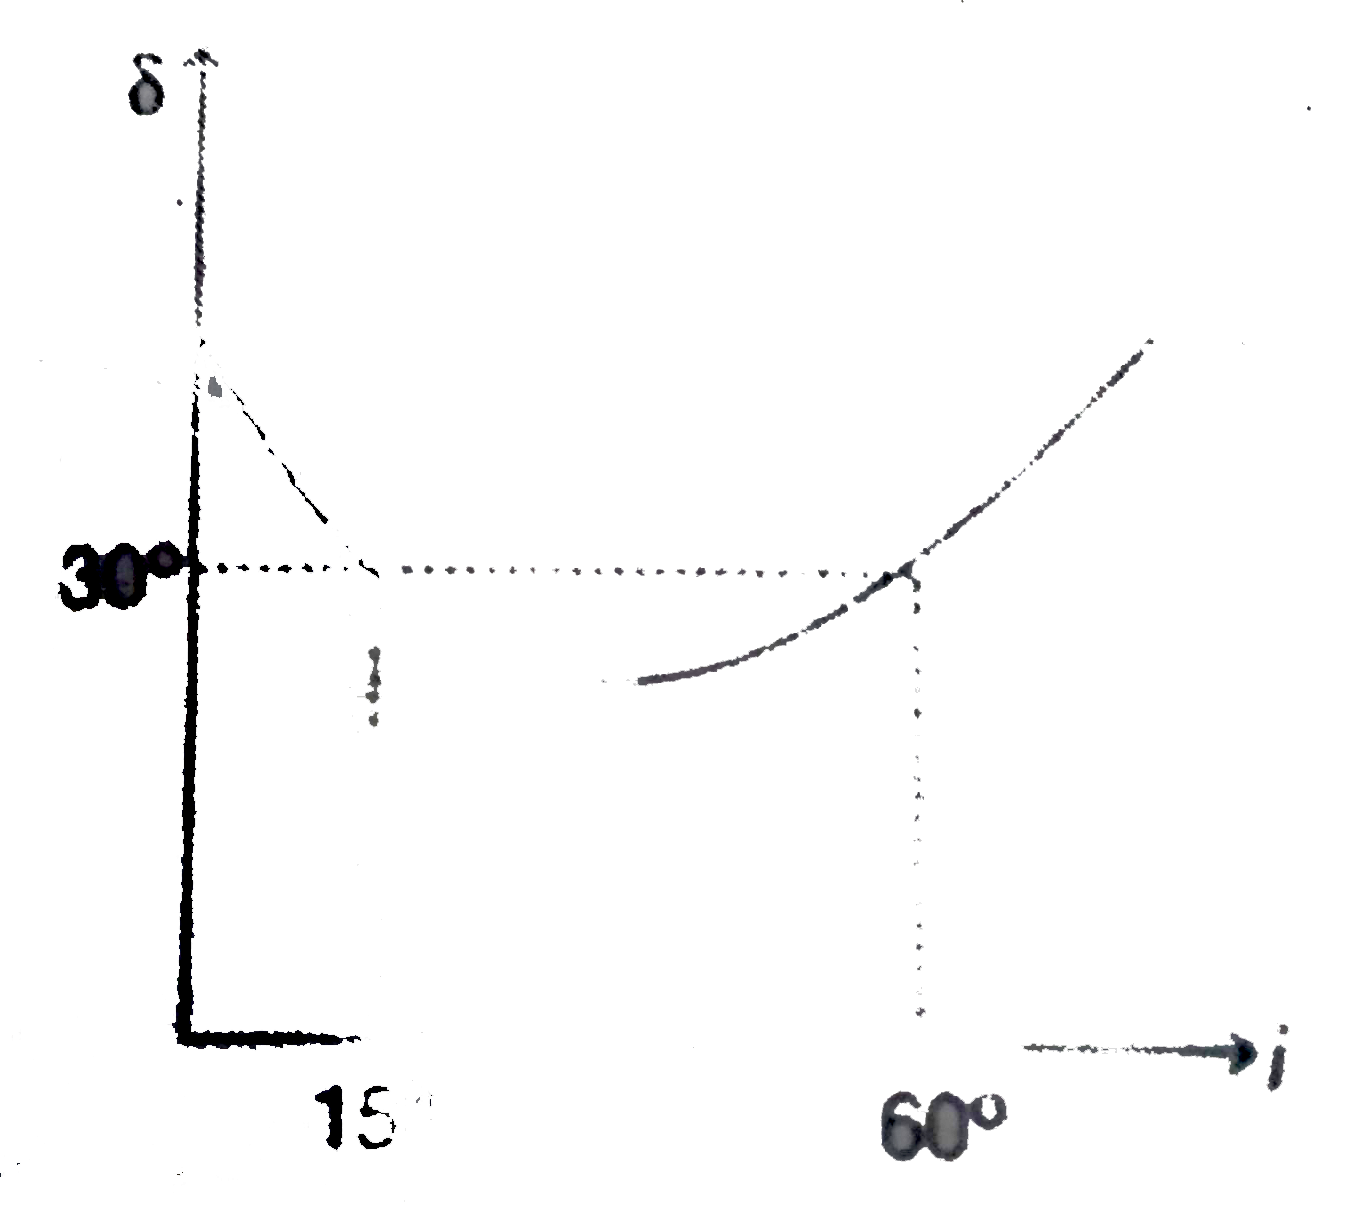
- Figure shown the graph of angle of deviation delta verses angle of inc...
Text Solution
|
- When an object is kept at a distance of 30cm from a concave mirror, th...
Text Solution
|
- A point object O is placed on the principal axis of a convex lens of f...
Text Solution
|
- A convex lens of focal length 30 cm forms a real image three times lar...
Text Solution
|
- In a plano-convex lens radius of curvature of the lens is 10 cm. if th...
Text Solution
|
- How much water (in cm) should be filled in a container of height 12 cm...
Text Solution
|
- A plane mirror is placed along the y-axis such that x-axis is normal t...
Text Solution
|
- A ray of light travelling in glass (mu=3//2) is incident on a horizont...
Text Solution
|
- Assume that you are sitting in a car at rest. You see a person in the ...
Text Solution
|
- A point source of light is placed inside water and a thin converging l...
Text Solution
|
- Image distance |v| s object distance|u|, curve for two biconvex lens w...
Text Solution
|
- Two identical equiconvex lenses made of glass of reflected index 1.5 p...
Text Solution
|
- Find the magnitude of velocity of image of a point object O with respe...
Text Solution
|
- A point object located at a distance of 15 cm from the pole of concave...
Text Solution
|
- A light ray is incident on face AB of a prism ABC as shown in figure. ...
Text Solution
|
- A block of mass 3kg is attached with an ideal spring of spring constan...
Text Solution
|