Home
Class 11
PHYSICS
Table -1 gives some graph for a particle...

Table -1 gives some graph for a particle moves along `x`-axis in positive `x`-direction. The variables `v,x` and `t` represent speed of particle, `x`-coordinate of particle and time respectively. Table -2 gives certain resulting interpretation. Match the graph in Table -1 with the statements in Table -2.

Text Solution

Verified by Experts

The correct Answer is:
A, B, C, D
Promotional Banner

Topper's Solved these Questions

  • KINEMATICS 1

    DC PANDEY|Exercise INTEGER_TYPE|15 Videos
  • KINEMATICS 1

    DC PANDEY|Exercise COMPREHENSION_TYPE|19 Videos
  • KINEMATICS

    DC PANDEY|Exercise INTEGER_TYPE|11 Videos
  • LAWS OF MOTION

    DC PANDEY|Exercise Medical entrances gallery|39 Videos

Similar Questions

Explore conceptually related problems
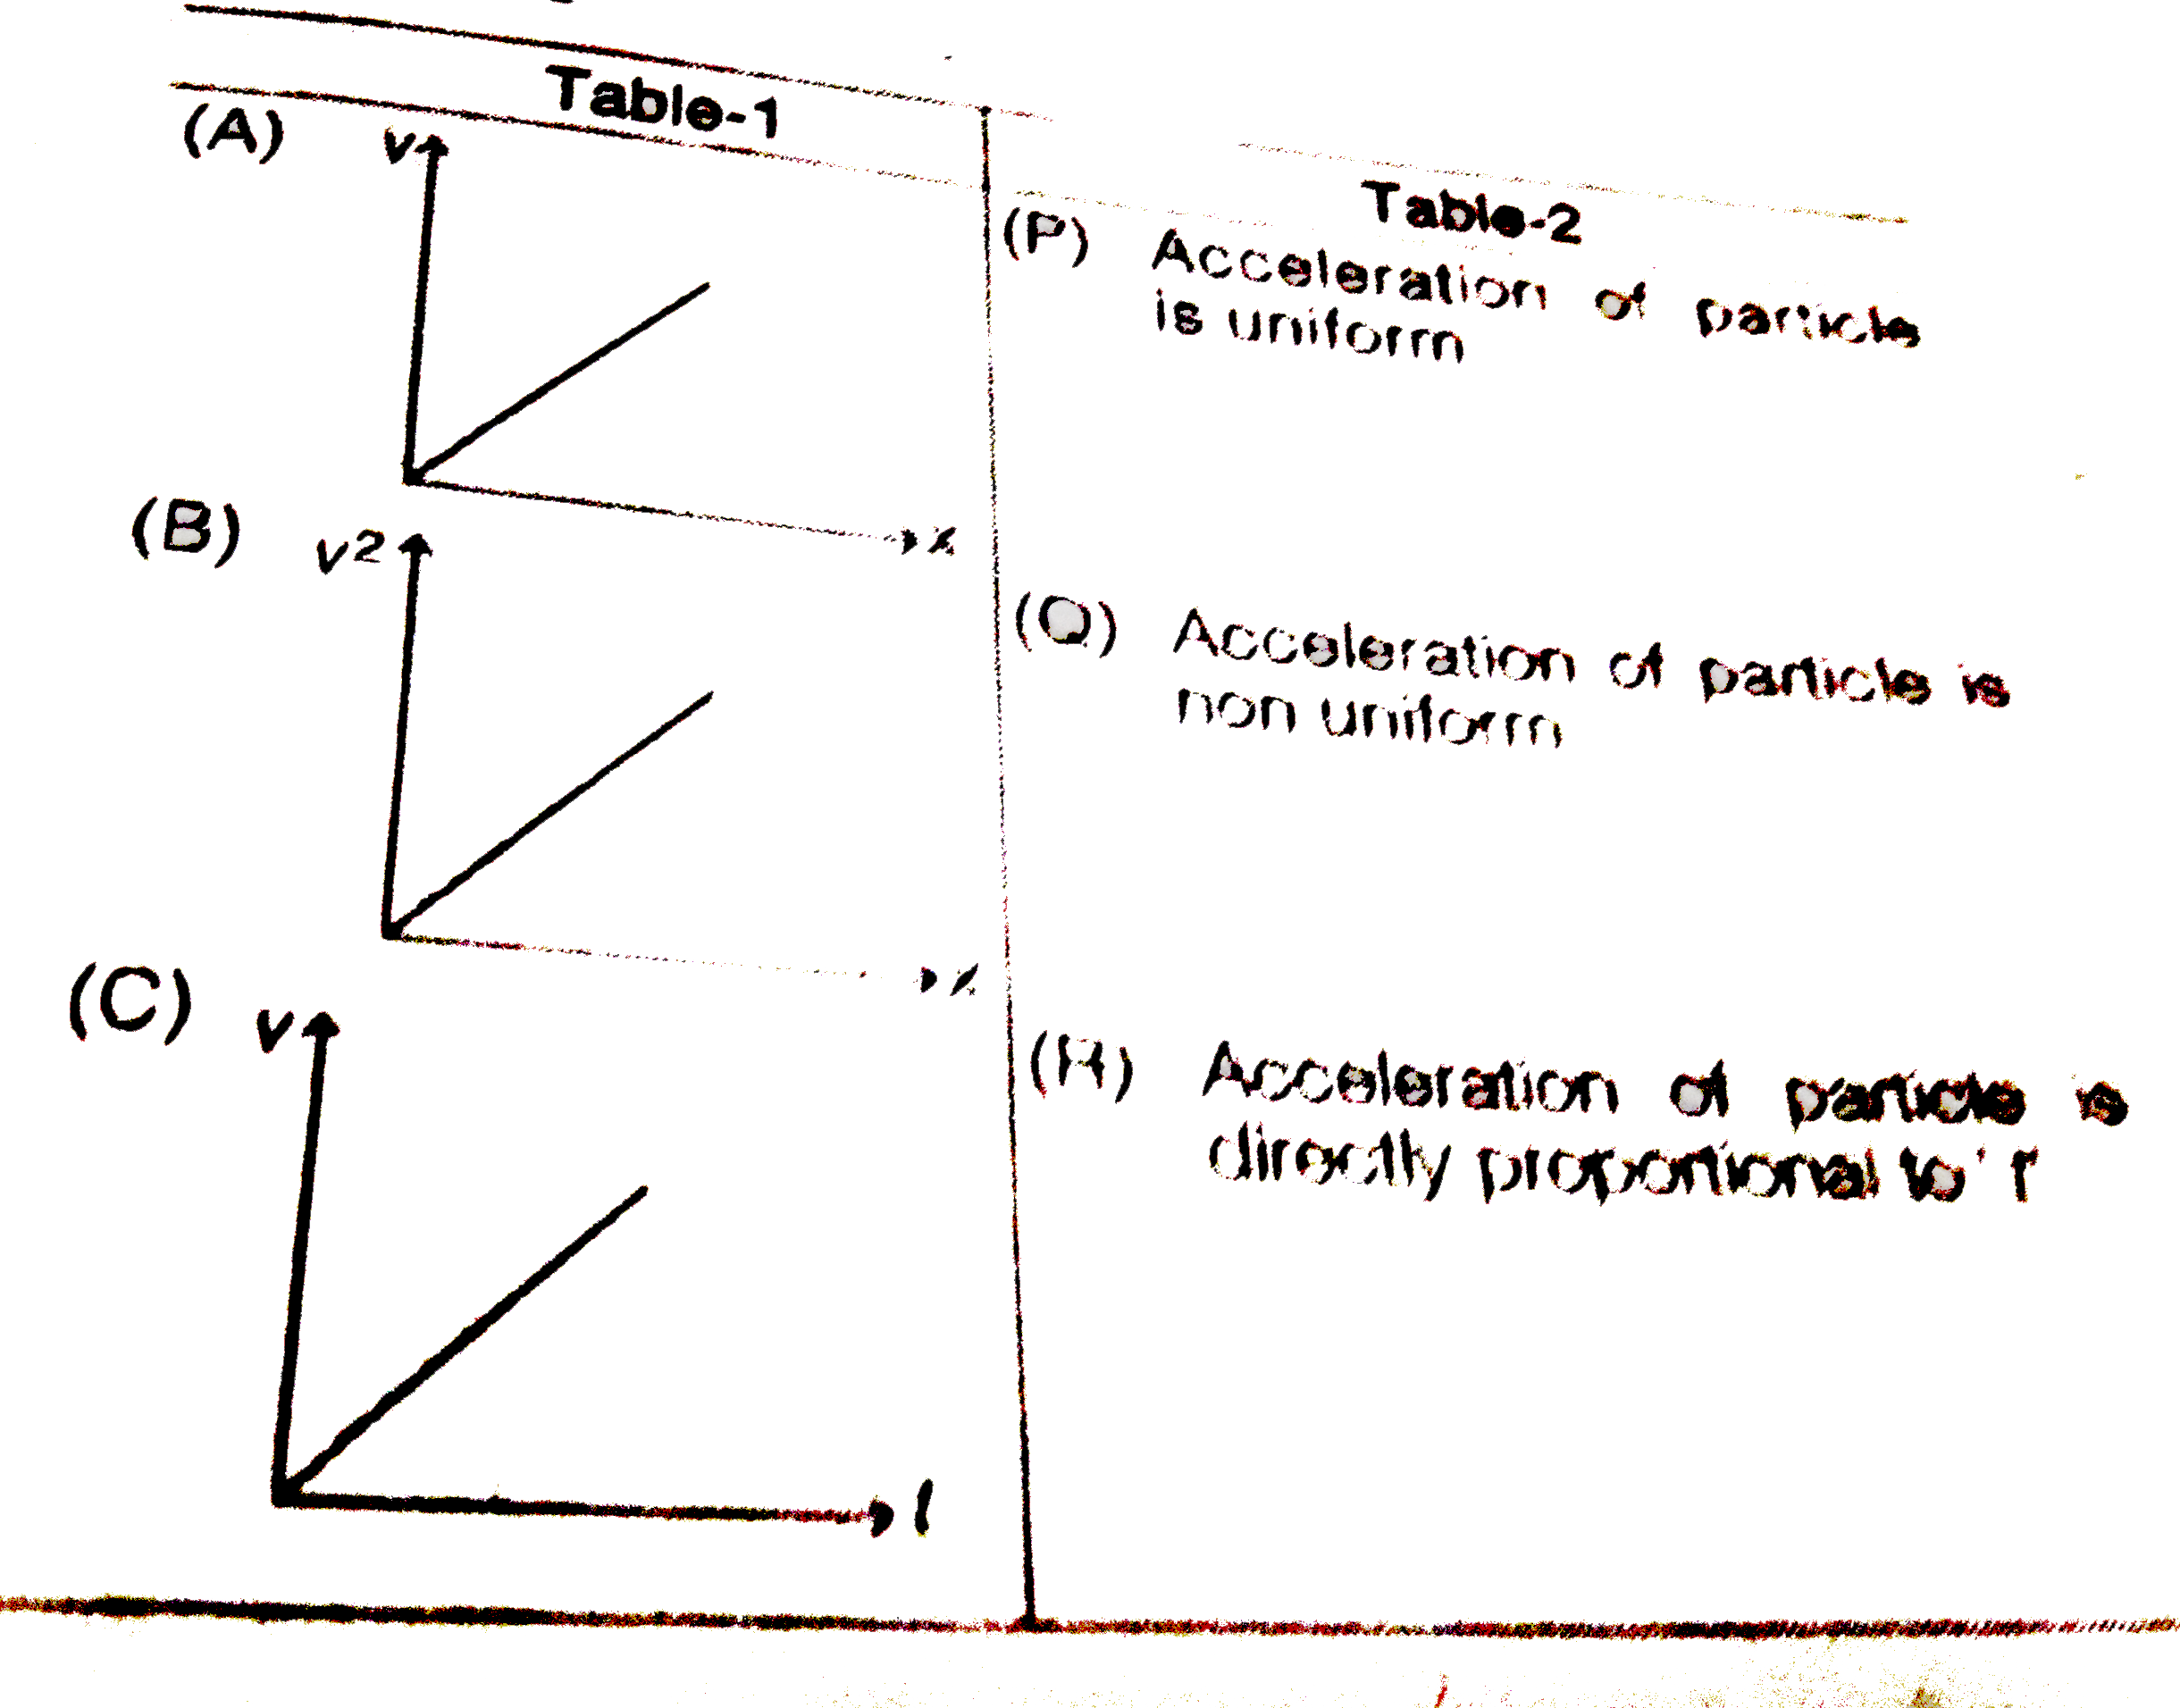
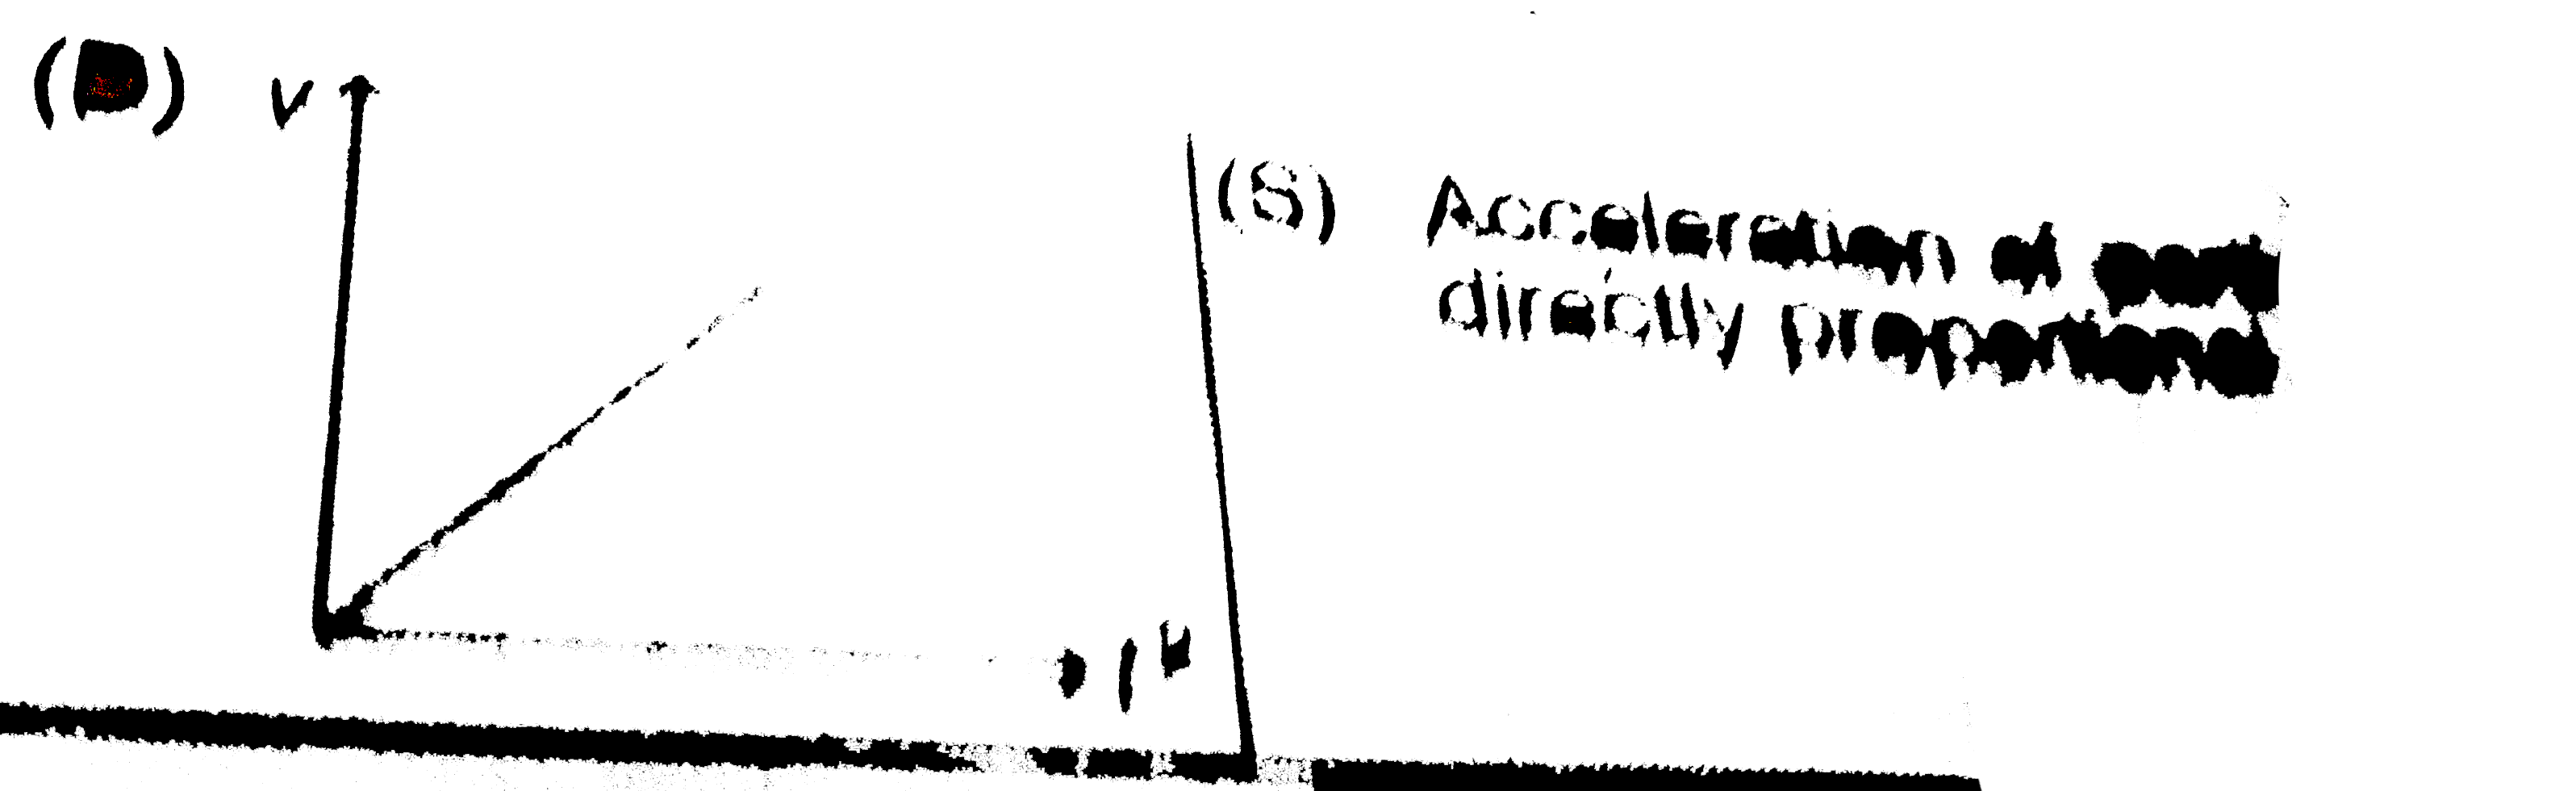
Position-time graph for a particle moving along x- direction is as shown in the figure. Average speed of the particle from t = 0 to t = 4 is :

For a particle moving along x-axis, velocity-time graph is as shown in figure. Find the displacement of the particle?

A particle moves along x -axis in positive direction. Its acceleration 'a' is given as a=cx+d , where x denotes the x - coordinate of particle, c and d are positive constants. For velocity position graph of particle to be of type as shown in figure, the value of speed of particle at x=0 should be

For a particle moving along x- axis, speed must be increasing for the following graph :

The velocity time graph for a particle moving along x-axis is shown in the figure. The corresponding displacement time graph is correctly shown by

For a particle moving along x-axis, a scaled x-6 graph is shown in figure. Mark the correct statement (s).

The velocity-time graph for a particle moving along X-axis is shown in the figure. The corresponding displacement-time graph is correctly shown by

The velocity time graph for a particle moving along X-axis is shown in the figure. The corresponding displacement time graph is correctly shown by

A particle is moving along the x-axis and its position-time graph is shown. Determine the sign of acceleration.