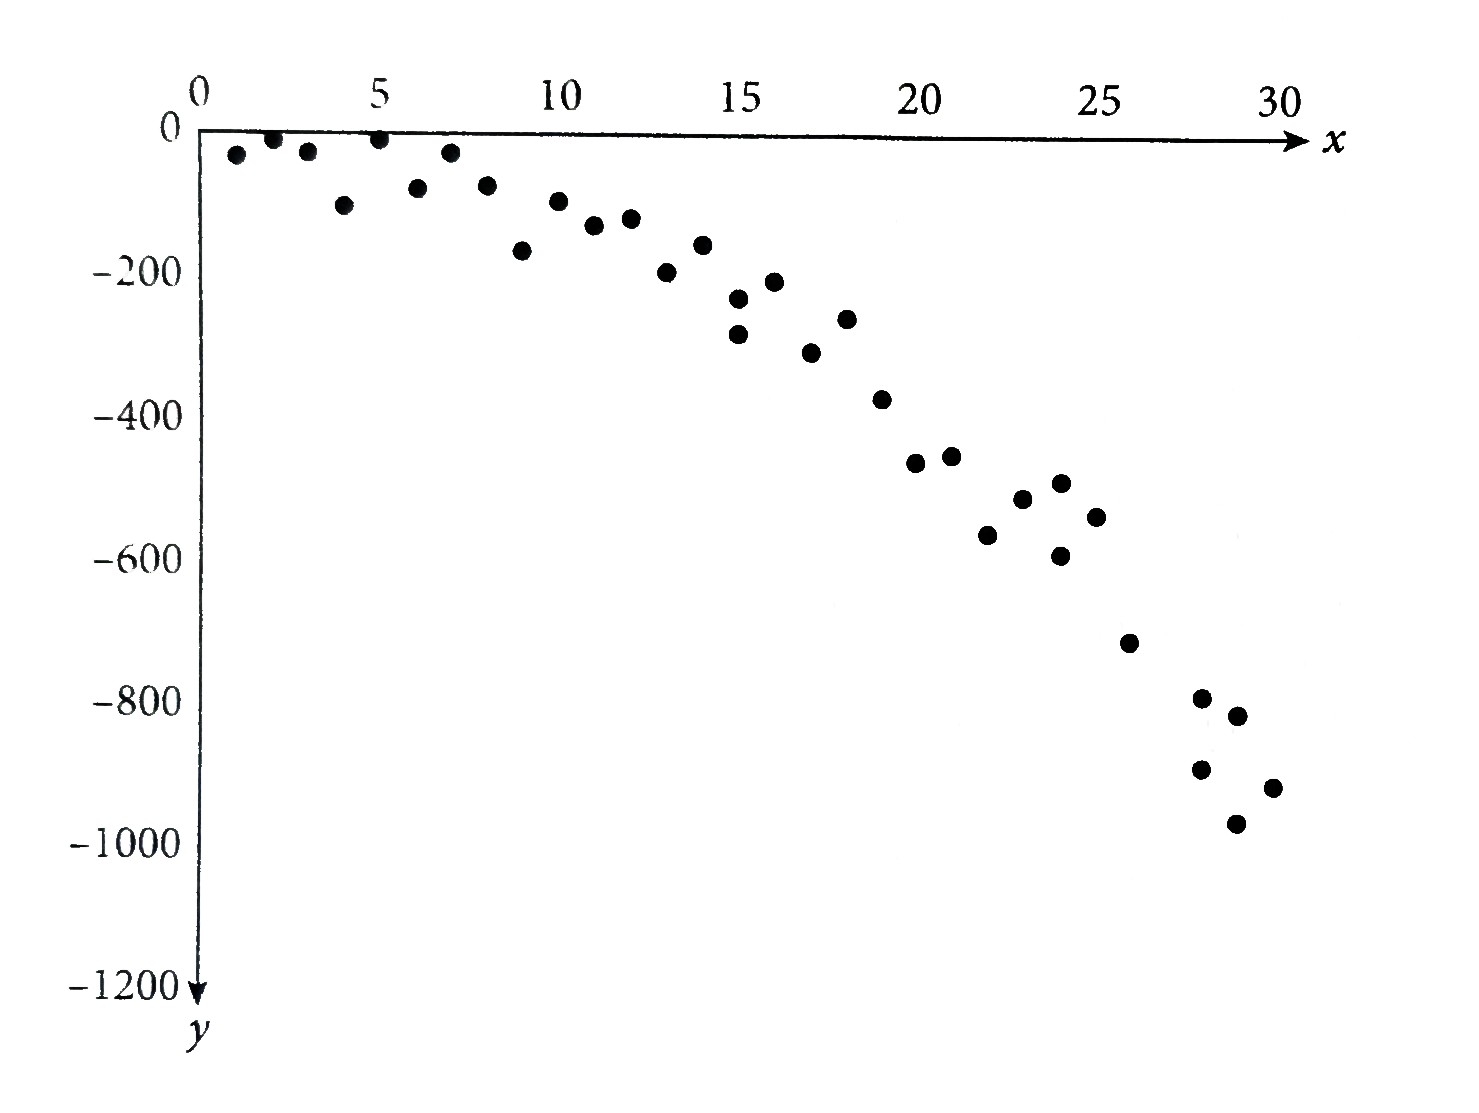
For which of the following values of a and b does the equation `y = ax ^(b)` model the data in the scatterplot above ?
A
`a lt 0,b lt 0`
B
`a lt 0,b gt 0`
C
` a gt 0, b lt 0`
D
`a gt 0,b gt 0`
Text Solution
Verified by Experts
The correct Answer is:
B
The shape of the data is concave down with an increasingly negative slope as x incrreases. The y-values of the data are negative, which indicates `a lt 0.` Eliminate (C ) and (D). As x increases, the magnitude of the y-valueds increases. This incdicates `b gt 0.` Note if `b lt 0,` the y-values would approach 0 as x increases. Thus, (B) is correct.
Topper's Solved these Questions
SCATTERPLOTS
KAPLAN|Exercise TRY ON YOUR OWN|20 Videos
SCATTERPLOTS
KAPLAN|Exercise LINE OF BEST FIT|1 Videos
SAT MATH: TIMING ANS SECTION MANAGEMENT STRATEGIES
KAPLAN|Exercise TRY ON YOU OWN|5 Videos
SYSTEMS OF LINEAR EQUATIONS
KAPLAN|Exercise NUMBER OF POSSIBLE SOLUTIONS|1 Videos
Similar Questions
Explore conceptually related problems
Which of the following values of b satisfies the equation 4,500=(900)/(b) ?
Which of the following equations best models the data shown in the scatterplot above?
In the equation above, k is a constant. For which of the following values f k does the equation have at least one re3al solution ?
y=3 y=ax^(2)+b In the system of equations above, a and b are constants. For which of the following values of a and b does the system of equations have exactly two real solutions?
The scatterplot above shows the avrage therms of naturela gas used by residential constomeers over a 12-month period. Of the following equations, which best models the data in the scatterplot ?
The scatterplot below compares the average gasoline prices I Boston, per gallon, to the average gasoline prices across the United States, per gallon, during a one-year period from 2017 to 2018. Of the following equations, whihc best modeles the data in the scatterplot ?
In the following data, find the values of a and b . Find the median class modal class :
The scatterplot below shows the amount of electric energy generated, in millions of megawatt-hours, by nuclear sources over a 10‑year period. Of the following equations, which best models the data in the scatterplot?
Given that a,b, and c are constants and that a gt 0, which of the following is the equation for the line of best fit for the above scatterplot ?
Which of the following is best modeled using a linear regression equation, y= ax+b, where a lt 0 ?