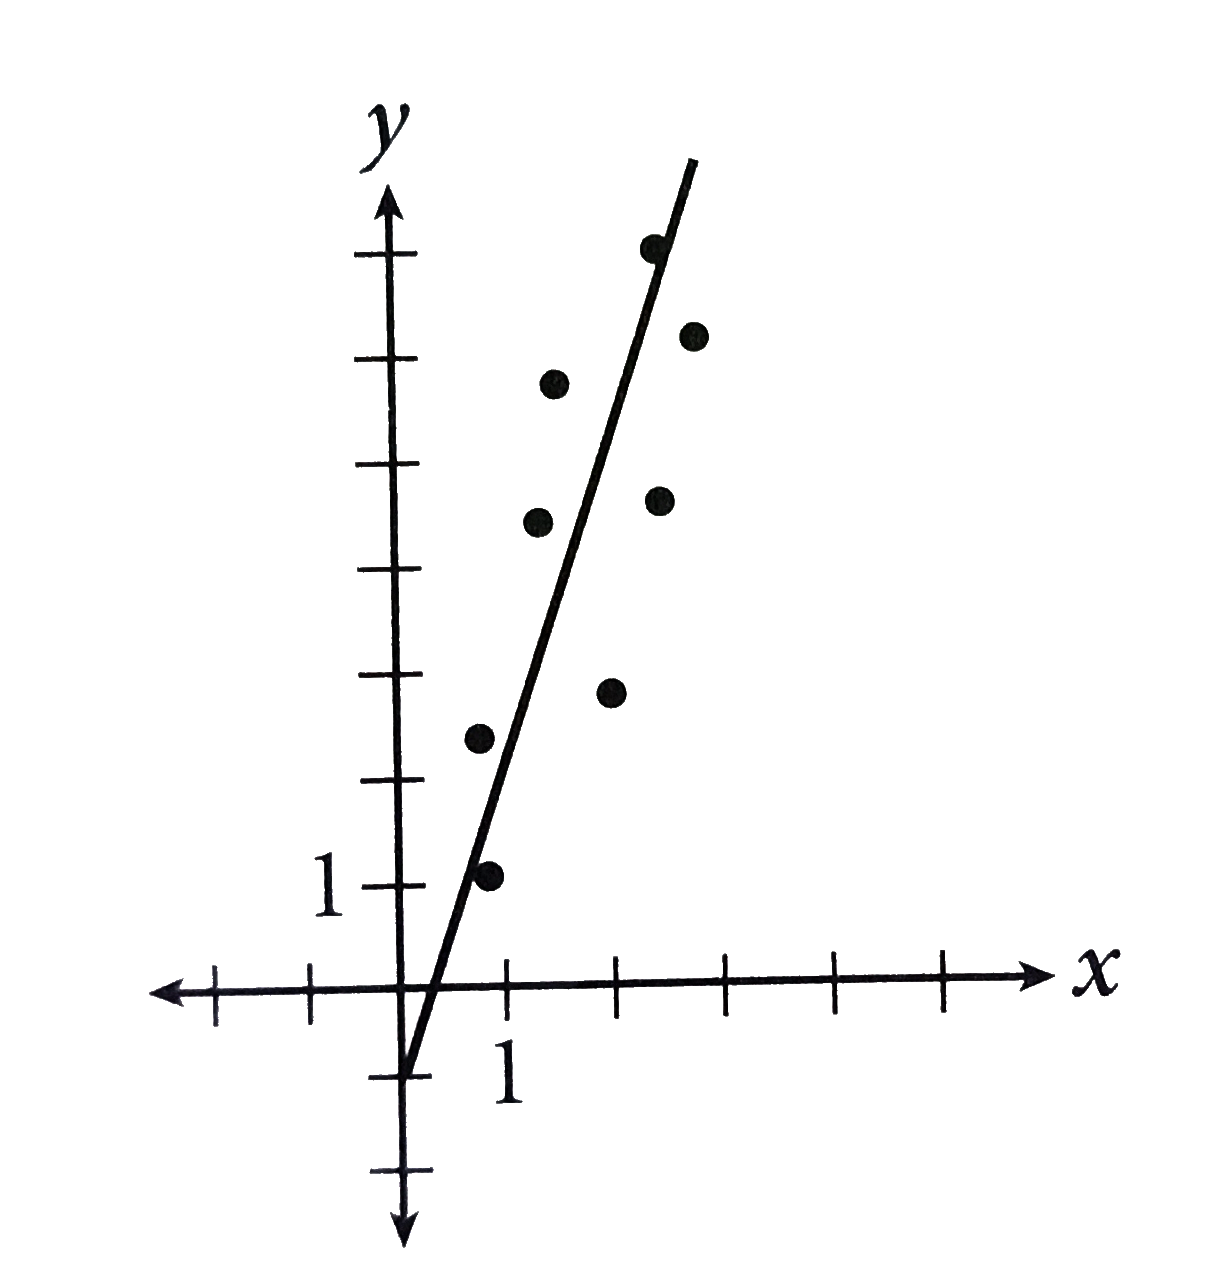
Which of the following equation corresponds to the line of best fit for the data set shown above ?
A
`y =0.4x-1`
B
`y=0.4x+1`
C
`y=2.5x+1`
D
`y=2.5x-1`
Text Solution
Verified by Experts
The correct Answer is:
D
Knowing where the y-intercept of the line of best fit falls will help you eliminate answer choices. Because the line of best fit intersects the y-axis below the x-axis, you know that the y-intercept is negative, so eliminate (B) and (C ) (the y-intercept is +1 for each of those lines). Now look at the slope. The line rises along the y-axis much faster than it runs along the x-axis, so the slope must be greater than 1, making (D) correct.
Topper's Solved these Questions
SCATTERPLOTS
KAPLAN|Exercise SCATTERPLOT MODELING|1 Videos
SCATTERPLOTS
KAPLAN|Exercise TRY ON YOUR OWN|20 Videos
SAT MATH: TIMING ANS SECTION MANAGEMENT STRATEGIES
KAPLAN|Exercise TRY ON YOU OWN|5 Videos
SYSTEMS OF LINEAR EQUATIONS
KAPLAN|Exercise NUMBER OF POSSIBLE SOLUTIONS|1 Videos
Similar Questions
Explore conceptually related problems
Which of the following equations represents the line shown in the graph?
Given that a,b, and c are constants and that a gt 0, which of the following is the equation for the line of best fit for the above scatterplot ?
Which of the following is most likely the slope of the line of best fit for the scatterplot above?
(##KPL_SAT_PRD_PLS_C09_E01_004_Q01.png" width="80%"> The scaterplot abouve shows data collected each year after the British Parlimament enacted a mandatory seat belt law and line of beast fit to the data. Which of the following equations best represents the trend of the data shown in the figure ?
Which of the following is an equation of line A in the xy-plane above
Which of the following is an equation of line in the xy -plane above?
Which of the following equation is best representation of given graph's?
Which of the following equation is best representation of given graph's?
Which of the following equation is best representation of given graph's?
Which of the following equation is best representation of given graph's?