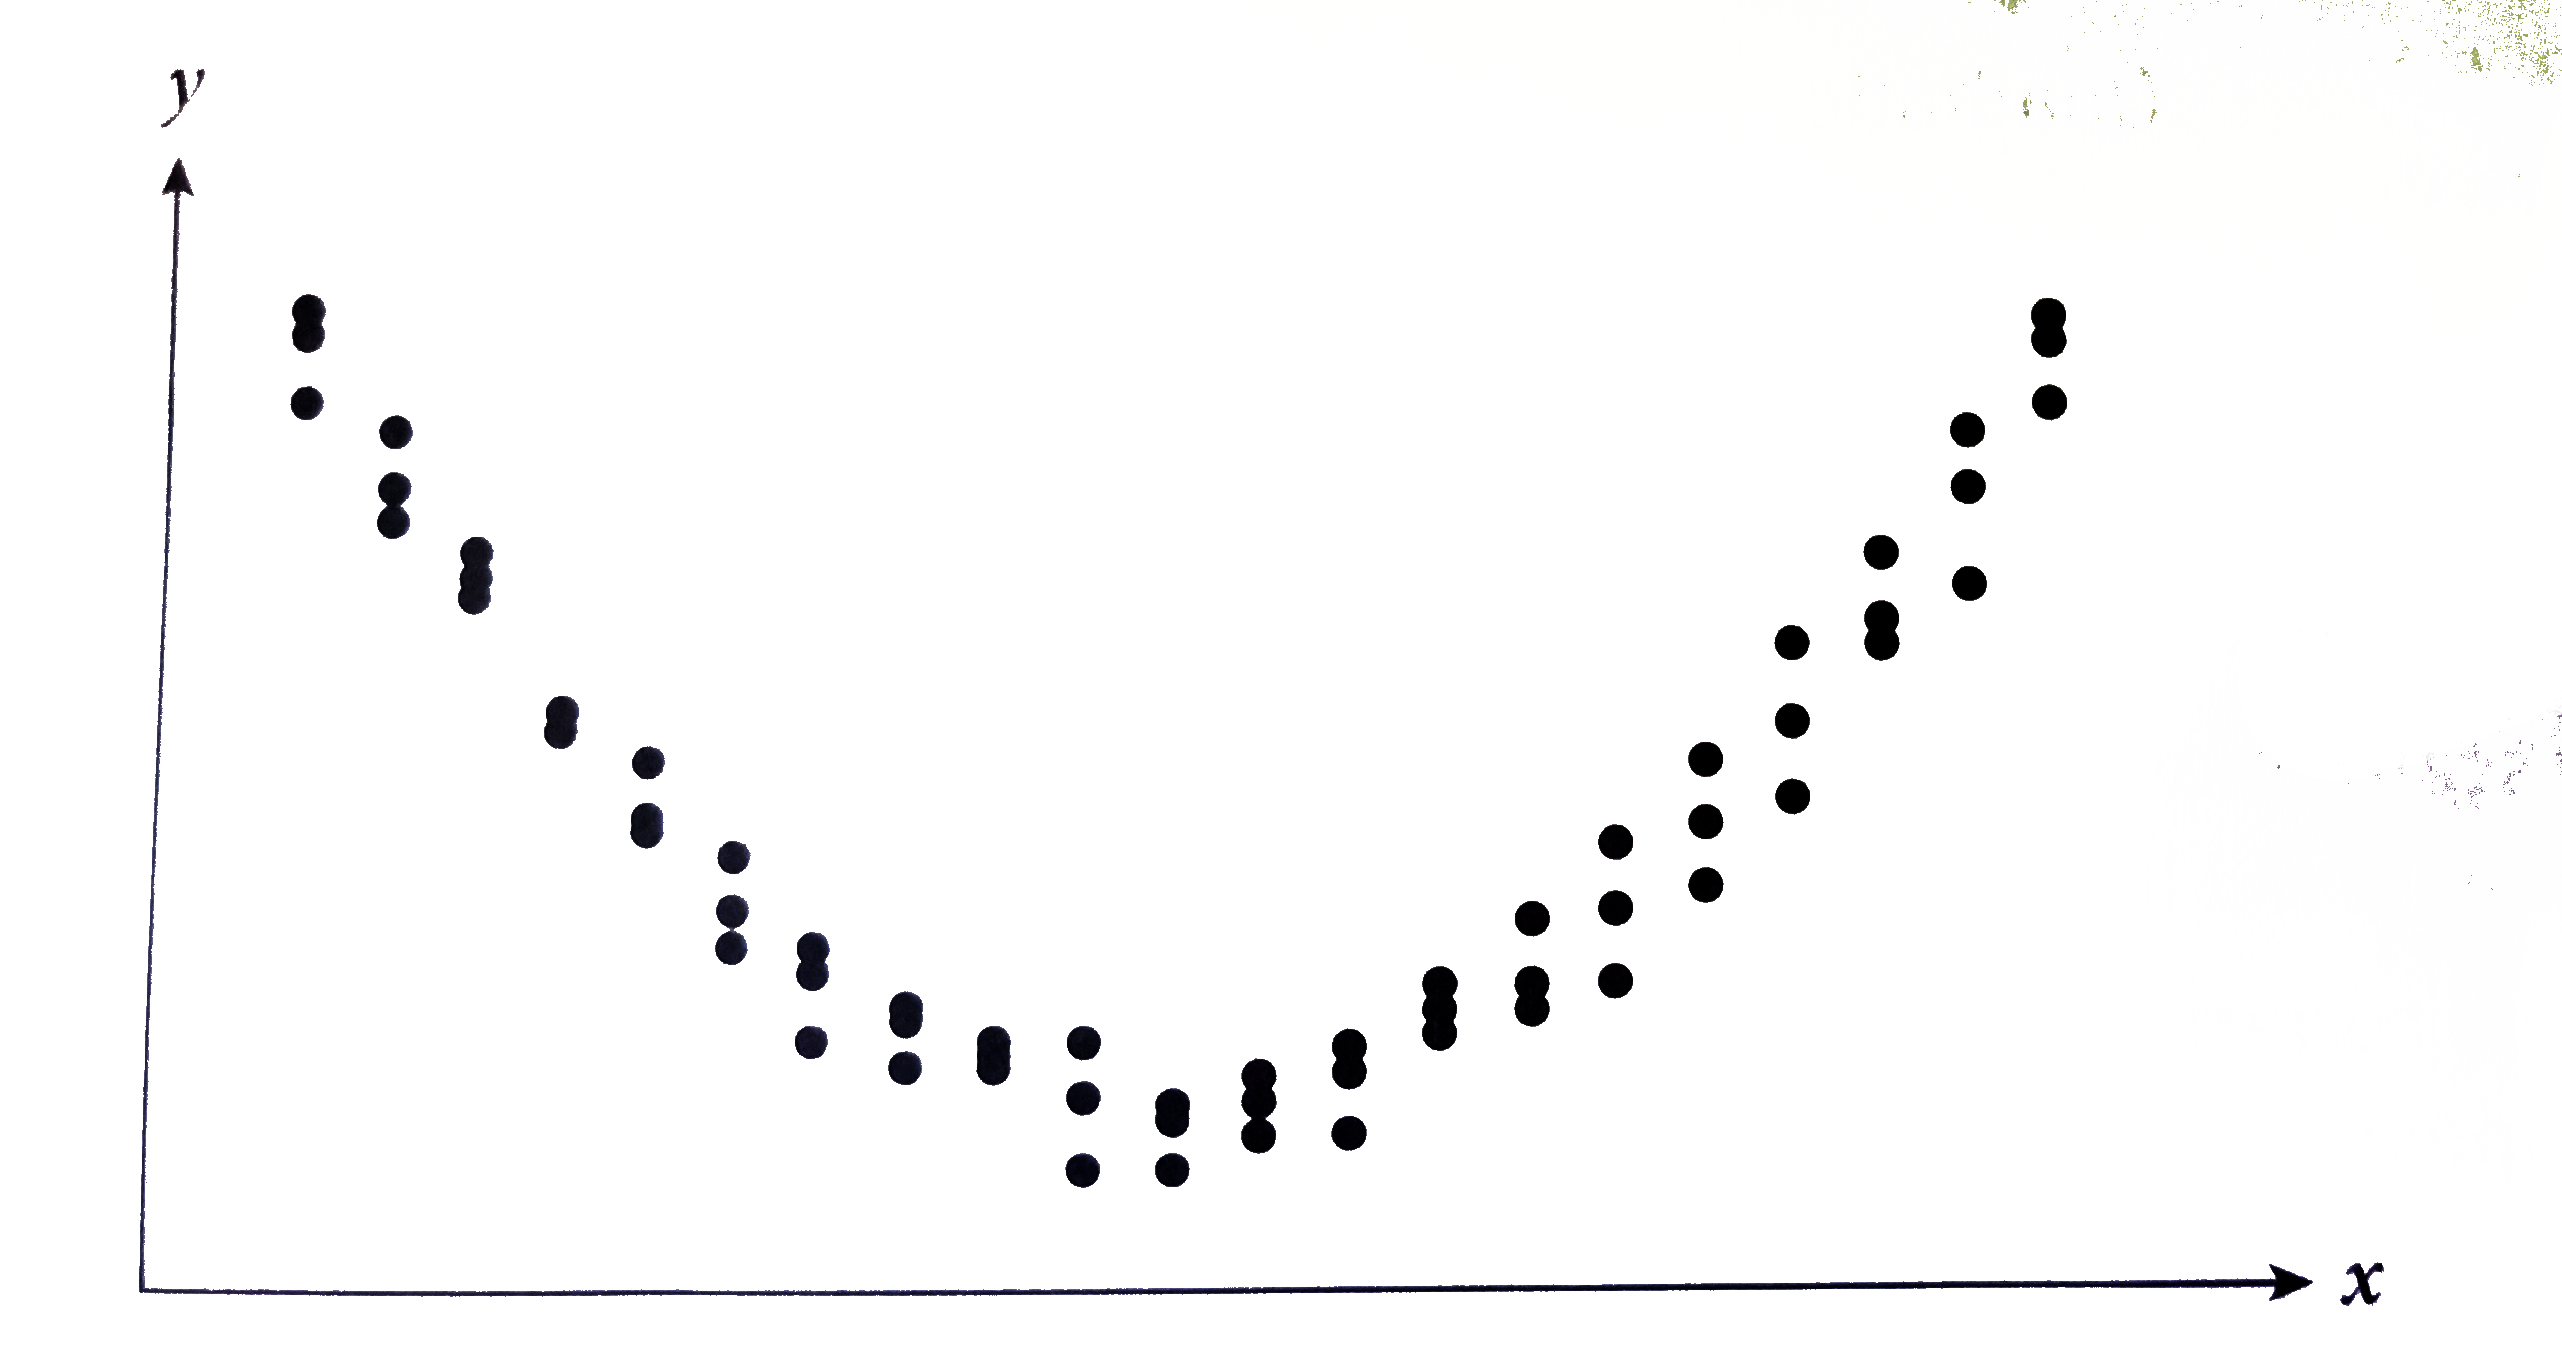
Given that a,b, and c are constants and that `a gt 0,` which of the following is the equation for the line of best fit for the above scatterplot ?
A
`y = ax +b`
B
`y = a ^(bx)`
C
`y =-ax ^(2) +bx+c`
D
`y = ax ^(2)+bx+c`
Text Solution
Verified by Experts
The correct Answer is:
D
The line of best fit for this scatterplot is curved, so it is not a straight line as would be created by the linear equation `y =ax +b.` Eliminate (A). The exponential equation `y =a ^(bx)` would results in a curve that opens upward in one direction. The lines of best fit of the scatterplot opens upward in two directions, so (B) is incorrect. Quadratic equations create parabolas when graphed, but the negative coefficient of the `x ^(2)` term means that (C ) would be a doenward-opening parabola rather than the upward-opening of the scatterplot. Thus, (D) is correct since that since that equation would be graphed as an upward-opening parabola.
Topper's Solved these Questions
SCATTERPLOTS
KAPLAN|Exercise LINE OF BEST FIT|1 Videos
SAT MATH: TIMING ANS SECTION MANAGEMENT STRATEGIES
KAPLAN|Exercise TRY ON YOU OWN|5 Videos
SYSTEMS OF LINEAR EQUATIONS
KAPLAN|Exercise NUMBER OF POSSIBLE SOLUTIONS|1 Videos
Similar Questions
Explore conceptually related problems
Which of the following is most likely the slope of the line of best fit for the scatterplot above?
Which of the following equation corresponds to the line of best fit for the data set shown above ?
Which of the following could be the equation of the line represented in the graph above?
Which of the following is an equation of line A in the xy-plane above
Which of the following is an equation of line in the xy -plane above?
If a+b gt 0 and c+d gt 0 , which of the following must be true ?
Which of the following best describes the type of association shown in the scatterplot above?
Which of the following is the most accurate statement about the scatterplot above ?
Which of the following equations best models the data shown in the scatterplot above?