Text Solution
Verified by Experts
The correct Answer is:


Topper's Solved these Questions
Similar Questions
Explore conceptually related problems
SUBHASH PUBLICATION-PROBABILITY -EXERCISE 15.1
- 1500 families with 2 children were selected randomly, and the followin...
Text Solution
|
- In a particular section of Class IX, 40 students were asked about the ...
Text Solution
|
- Three coins are tossed simultaneously 200 times with the following fre...
Text Solution
|
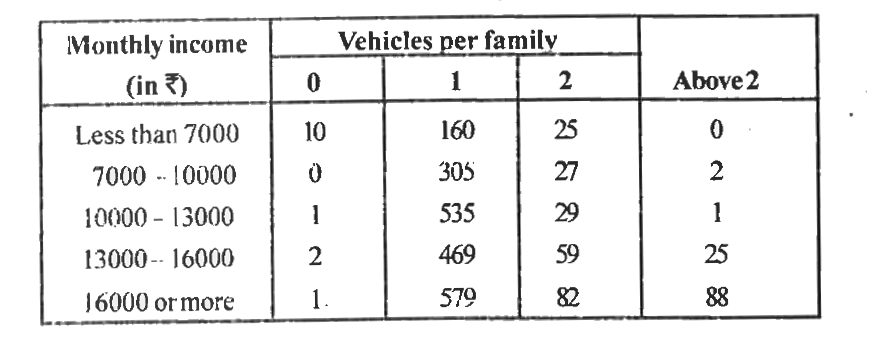
- An organisation selected 2400 families at random and surveyed them to ...
Text Solution
|
- An organisation selected 2400 families at random and surveyed them to ...
Text Solution
|
- An organisation selected 2400 families at random and surveyed them to ...
Text Solution
|
- An organisation selected 2400 families at random and surveyed them to ...
Text Solution
|
- An organisation selected 2400 families at random and surveyed them to ...
Text Solution
|
- A teacher analyses the performance of two sections of students in a ma...
Text Solution
|
- A teacher analyses the performance of two sections of students in a ma...
Text Solution
|
- To know the opinion of the students about the subject statistics , a s...
Text Solution
|
- To know the opinion of the students about the subject statistics , a s...
Text Solution
|
- Distance (in km) of 40 engineers from their place of residence to thei...
Text Solution
|
- Distance (in km) of 40 engineers from their place of residence to thei...
Text Solution
|
- Distance (in km) of 40 engineers from their place of residence to thei...
Text Solution
|
- Activity : Note the frequency of two - wheelers , three - wheelers and...
Text Solution
|
- Activity : Ask all the students in your class to write a 3 - digit num...
Text Solution
|
- Eleven bags of wheat flour, each marked 5 kg actually contained the fo...
Text Solution
|
- In , you were asked to prepare a frequency distribution table regardin...
Text Solution
|
- In , you were asked to prepare a frequency distribution table regardin...
Text Solution
|