Text Solution
Verified by Experts


Topper's Solved these Questions
MOTION IN A STRAIGHT LINE
GRB PUBLICATION|Exercise Problem|14 VideosMOTION IN A STRAIGHT LINE
GRB PUBLICATION|Exercise Problems and Practice|16 VideosFRICTION AND CIRCULAR MOTION
GRB PUBLICATION|Exercise Comprehension type|11 VideosMOTION IN TWO AND THREE DIMENSIONS
GRB PUBLICATION|Exercise All Questions|210 Videos
Similar Questions
Explore conceptually related problems
GRB PUBLICATION-MOTION IN A STRAIGHT LINE-Comprehension type Queston
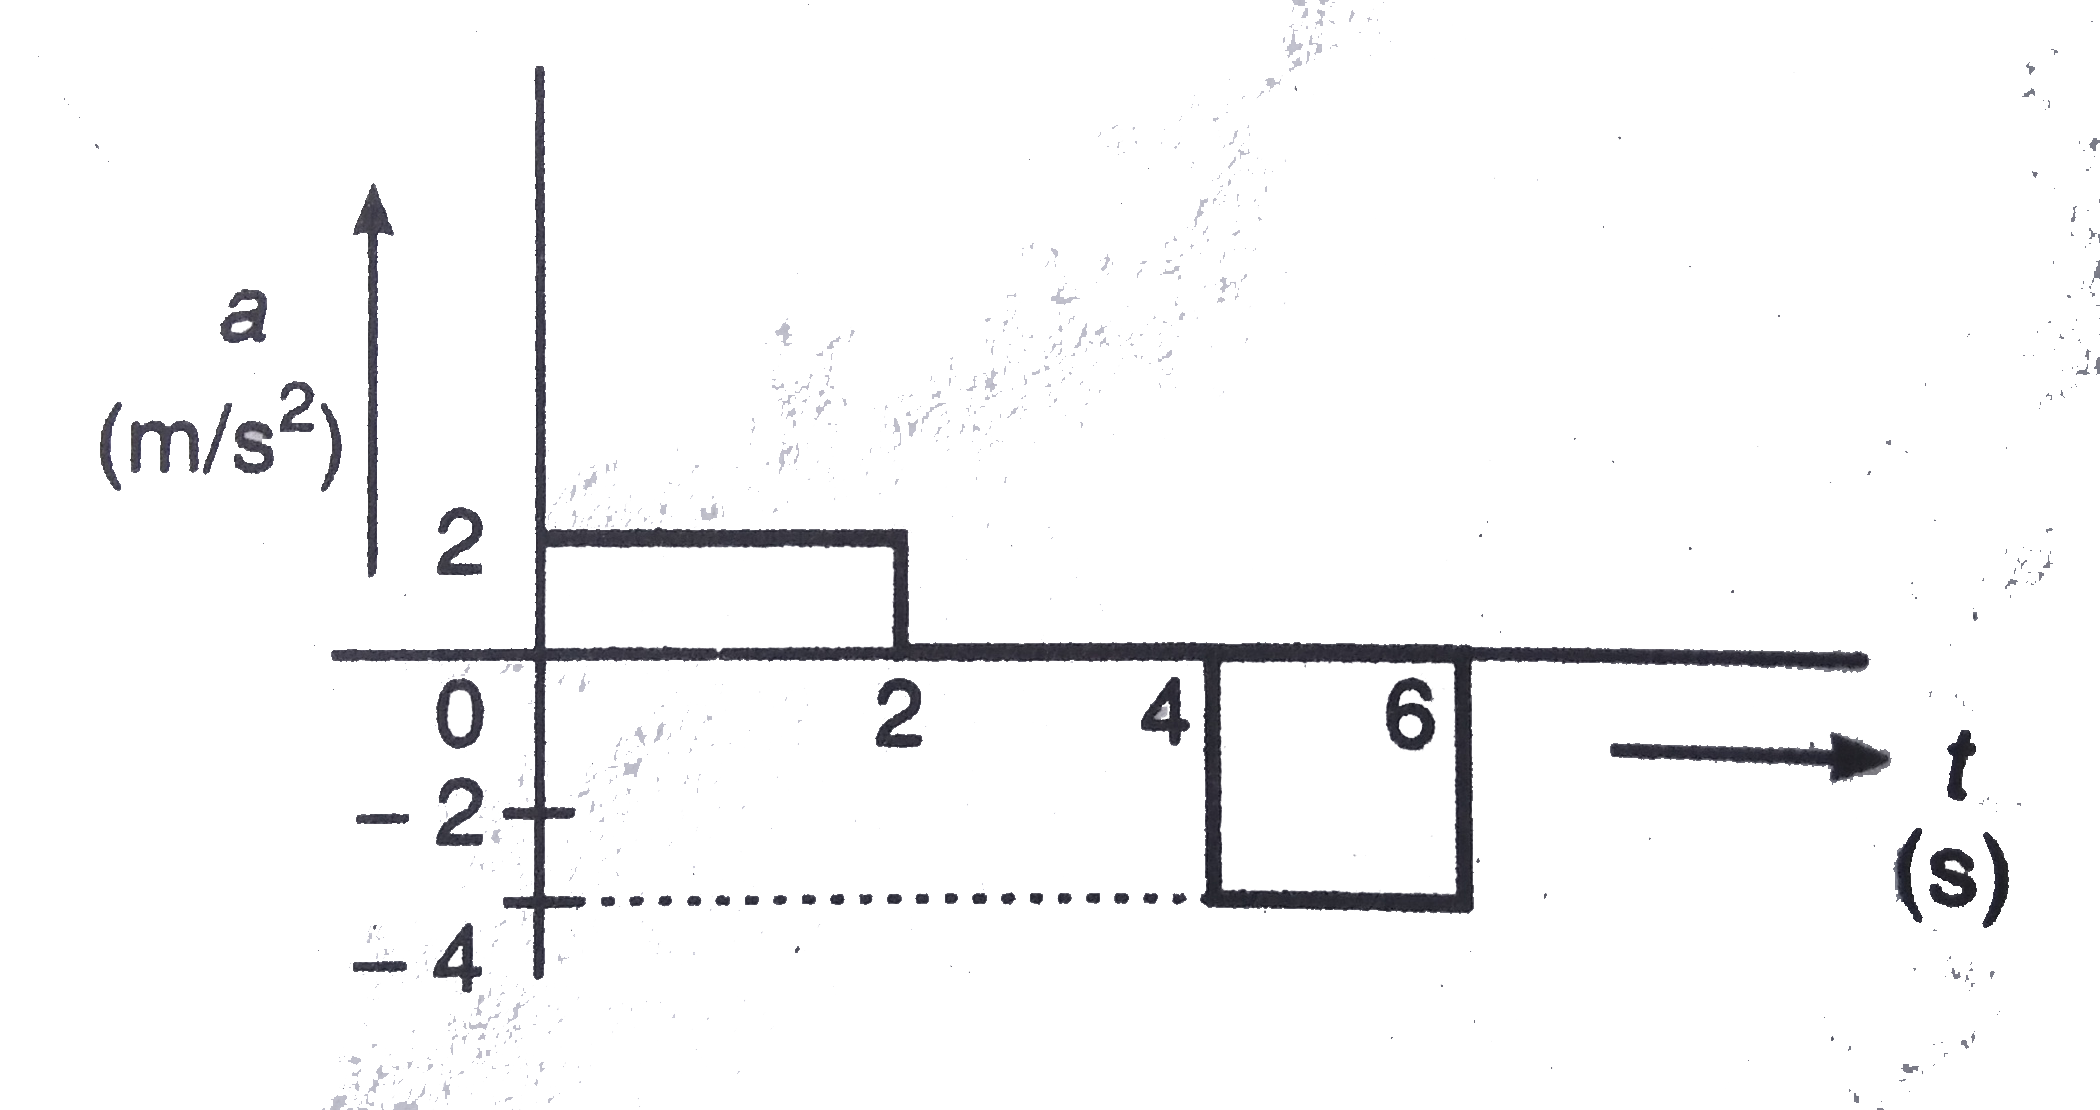
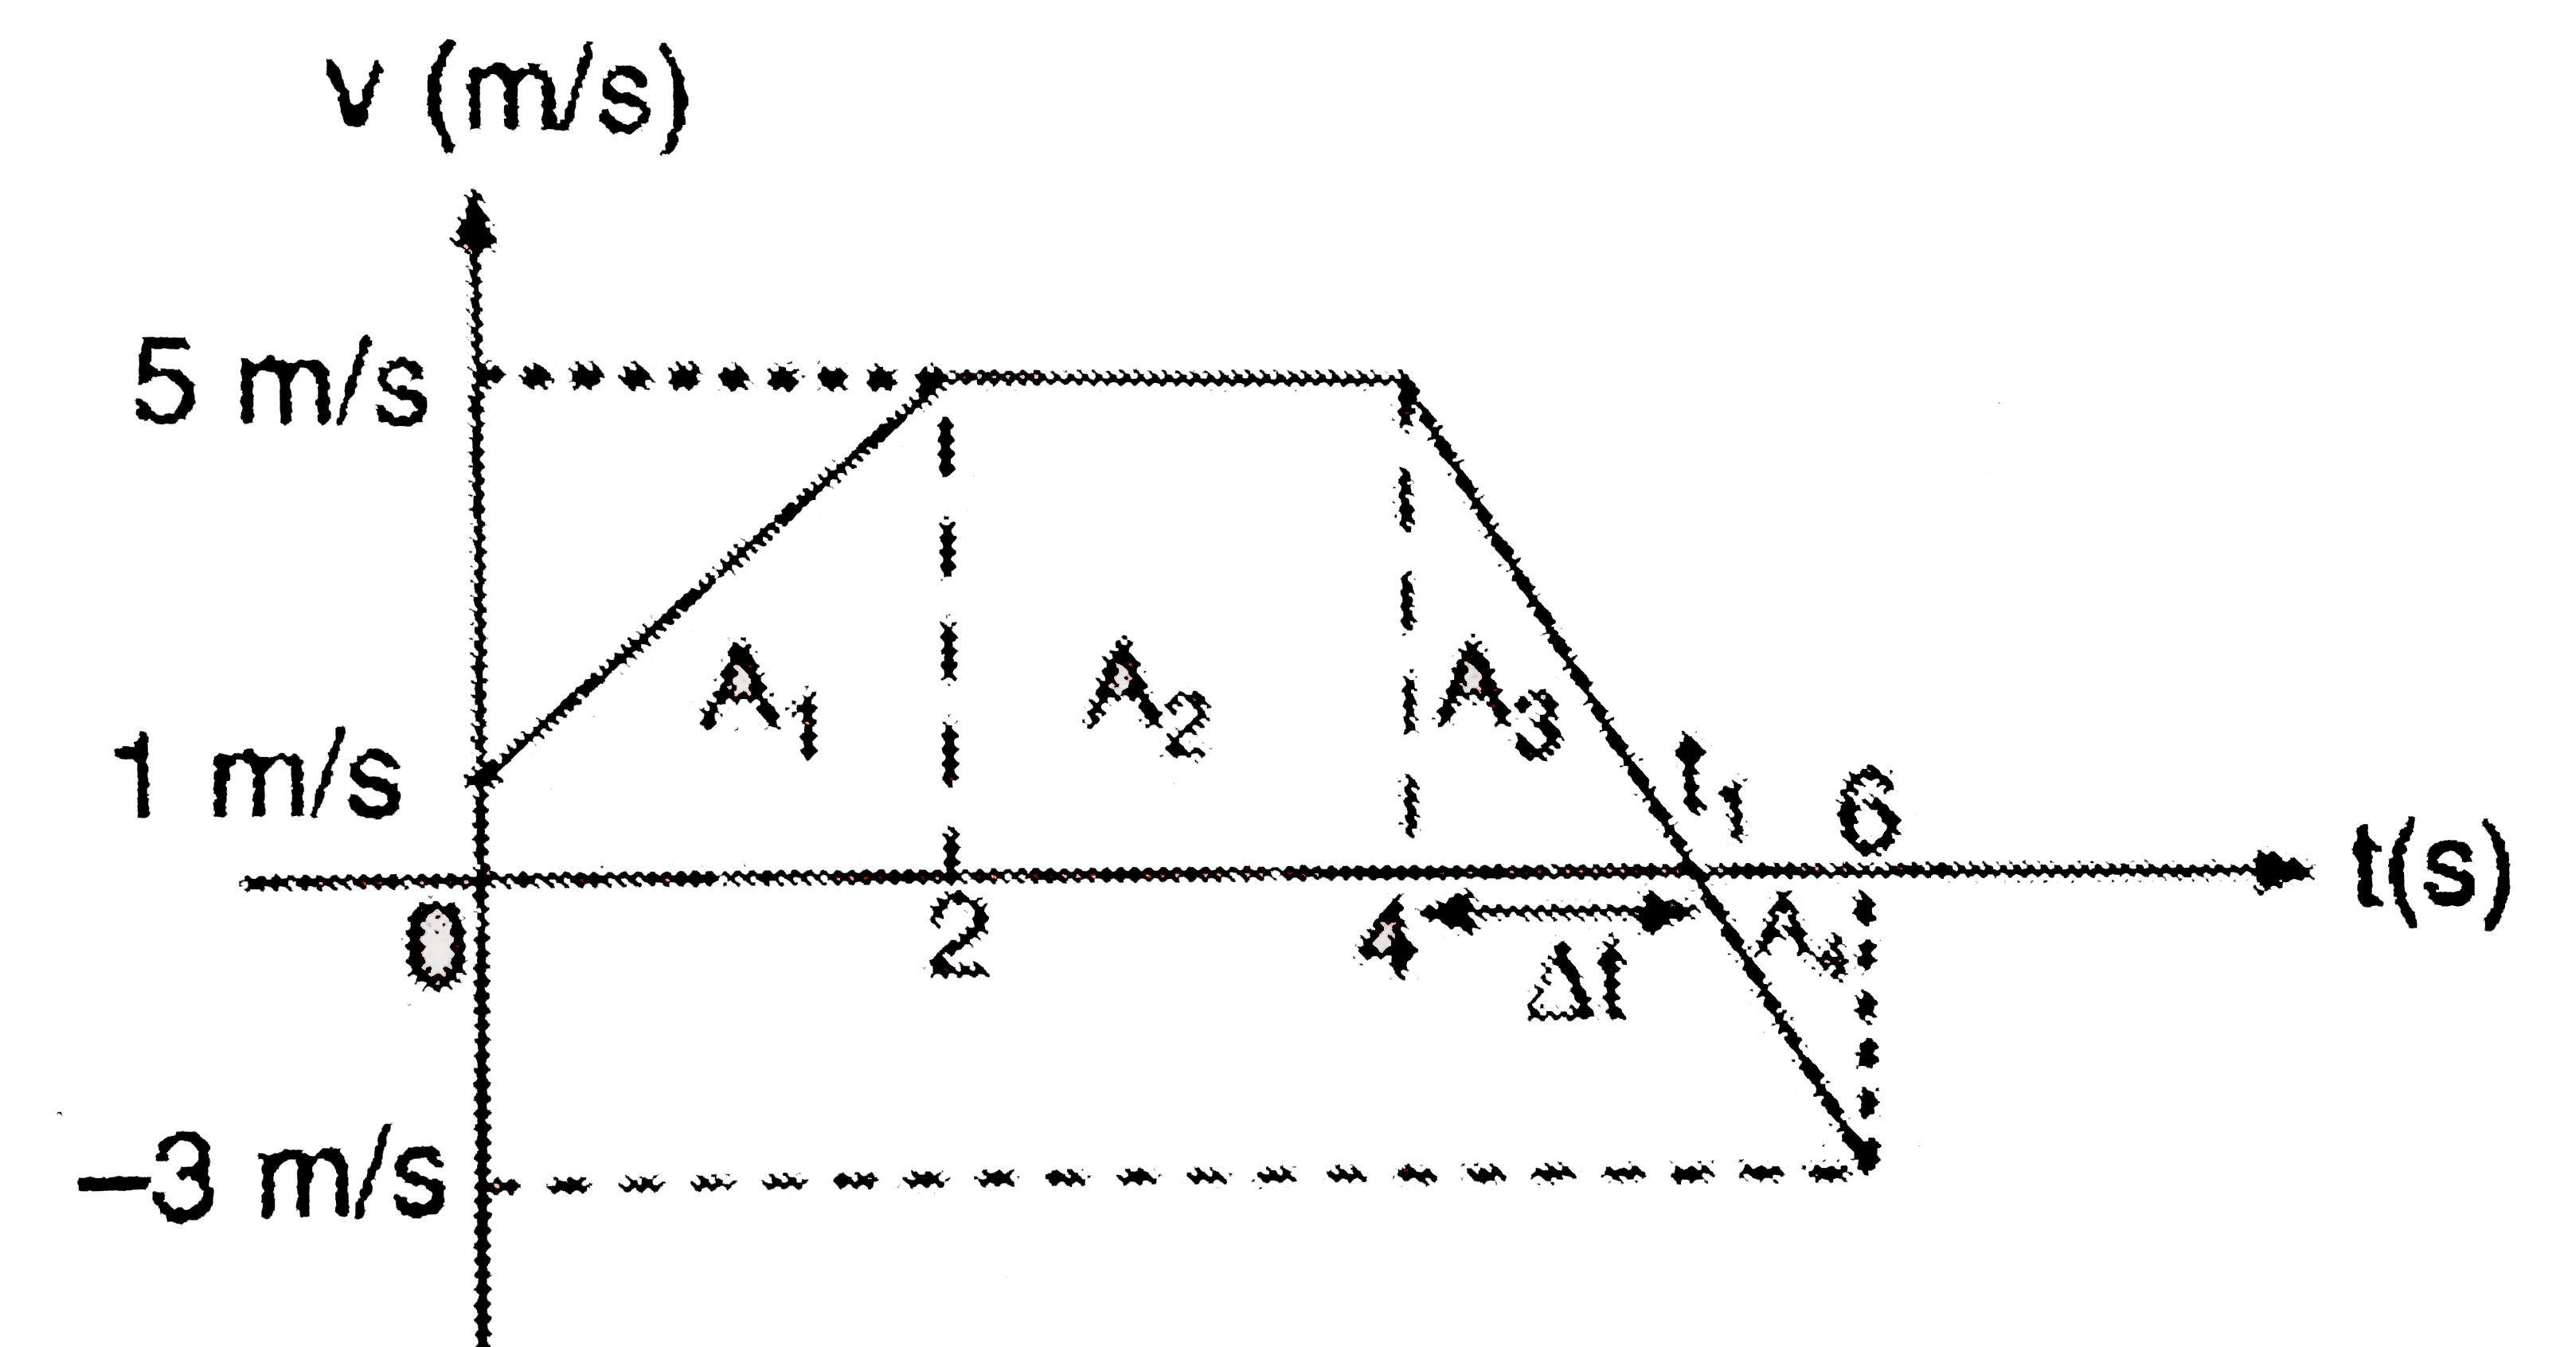
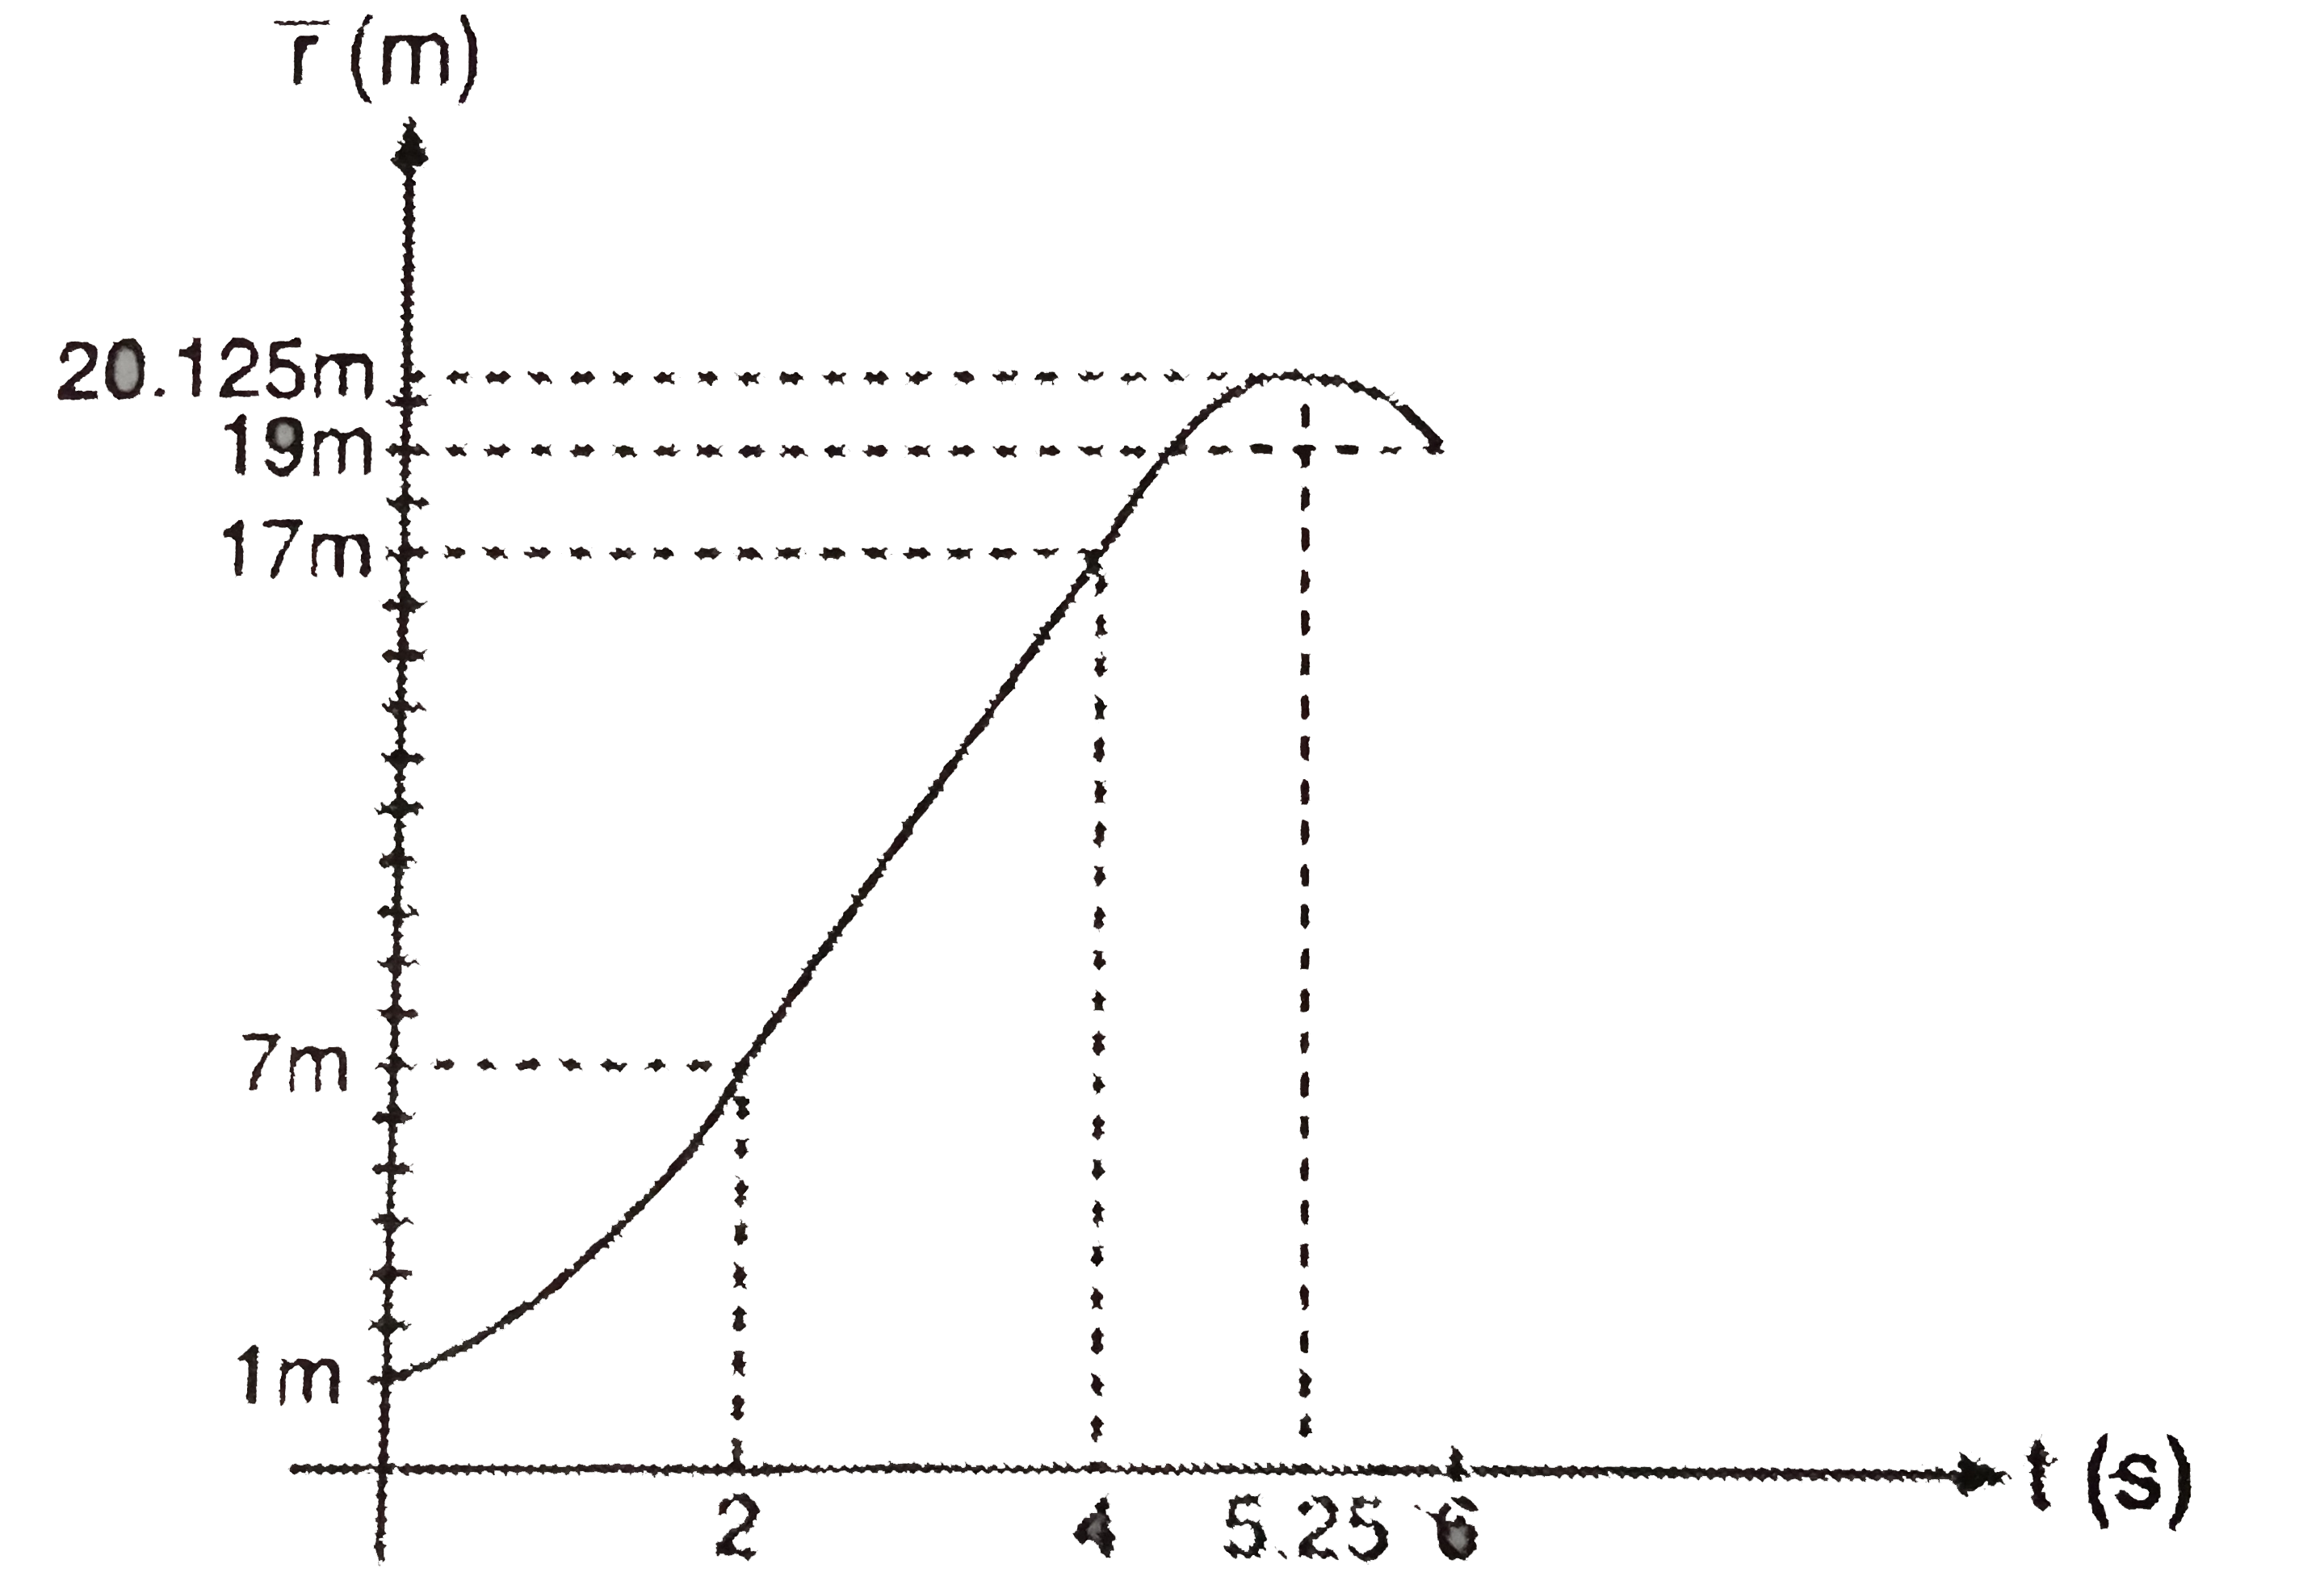
- The acceleration versus time graph of a particle moving along a straig...
Text Solution
|
- A particle is moving along X-axis under a force such that its position...
Text Solution
|
- A particle is moving along X-axis under a force such that its position...
Text Solution
|
- A particle is moving along X-axis under a force such that its position...
Text Solution
|
- A particle is moving along X-axis under a force such that its position...
Text Solution
|
- A particle is moving along X-axis under a force such that its position...
Text Solution
|
- A particle is moving along X-axis under a force such that its position...
Text Solution
|
- A person standing on the roof of a building throws a ball vertically u...
Text Solution
|
- A person standing on the roof of a building throws a ball vertically u...
Text Solution
|
- A person standing on the roof of a building throws a ball vertically u...
Text Solution
|
- A person standing on the roof of a building throws a ball vertically u...
Text Solution
|
- A person standing on the roof of a building throws a ball vertically u...
Text Solution
|
- Consider a particle moving along x-axis. Its distance from origin O is...
Text Solution
|
- Consider a particle moving along x-axis. Its distance from origin O is...
Text Solution
|
- Consider a particle moving along x-axis. Its distance from origin O is...
Text Solution
|