Home
Class 11
PHYSICS
Given a speed-time graph of a particle i...

Given a speed-time graph of a particle in motion along a constant direction. Three equal intervals of time are shown. In which interval is the average acceleration greatest in magnitude? In which interval is the average speed greatest? Choosing the positive direction as the constant direction of motion, give the signs of `v` and `a` in the three intervals. What are the accelerations at the points ` A, B , C` and ` D` ?
.

Text Solution

Verified by Experts

Average acceleration is greatest in interval 2
Average speed is greatest in interval 3
v is positive in intervals 1, 2, and 3
a is positive in intervals 1 and 3 and negative in interval 2
a = 0 at A, B, C, D
Acceleration is given by the slope of the speed-time graph. In the given case, it is given by the slope of the speed-time graph within the given interval of time.
Since the slope of the given speed-time graph is maximum in interval 2, average acceleration will be the greatest in this interval.
Height of the curve from the time-axis gives the average speed of the particle. It is clear that the height is the greatest in interval 3. Hence, average speed of the particle is the greatest in interval 3.
In interval 1:
The slope of the speed-time graph is positive. Hence, acceleration is positive. Similarly, the speed of the particle is positive in this interval.
In interval 2:
The slope of the speed-time graph is negative. Hence, acceleration is negative in this interval. However, speed is positive because it is a scalar quantity.
In interval 3:
The slope of the speed-time graph is zero. Hence, acceleration is zero in this interval. However, here the particle acquires some uniform speed. It is positive in this interval.
Points A, B, C, and D are all parallel to the time-axis. Hence, the slope is zero at these points. Therefore, at points A, B, C, and D, acceleration of the particle is zero.
Promotional Banner

Topper's Solved these Questions

Similar Questions

Explore conceptually related problems

Fig. 2 (NCT). 10 . Give a speed-tiem graph of a particle in one dimenstional motion. Three different equal intervals of time are shwon. In which interval is the average acceleration graeatest in magnitude ? In which interval is the average speed greatest ? Choosing the positive direction as the constant direction of motion, give the signs of u and a in the three intervals. What are the acclerations at teh points A, B , C and D ? .

Fig. 2 (NCT).9 show the x-t plot of a particle in one dimensional motion. Three different equal intervals of time are shown. In which interval the average speed is greatest and in which it is the least ? Give the sign of average speed for each interval. .

The velocity-time graph of an object is given below. Calculate the average acceleration of the object in the time interval of 4 s to 6 s.

The speed-time graph of a particle moving along a fixed direction is shown in figure. Obtain the distance traversed by the particle between (a)t=0s to 10s(b)t=2s to 6s What is the average speed of the particle over the intervals in a and b?

Position-time graph for a particle moving along x- direction is as shown in the figure. Average speed of the particle from t = 0 to t = 4 is :

The v-t graph for a particle moving along x-axis is shown in the figure, find (a) Average velocity in the interval 0 to 8 s. (b) Average speed in the interval 0 to 8 s. (c) Average acceleration in the interval 0 to 4 s. (d) Instantaneous acceleration at t = 2.5 s.

The velocity-time graph of a body is shown in figure. The ratio of magnitude of average acceleration during the intervals OA and AB is

The position (x) - time (t) graph for a particle moving along a straight line is shown in figure. The average speed of particle in time interval t = 0 to t = 8 s is

NCERT-MOTION IN A STRAIGHT LINE-EXERCISE
  1. Two towns A and B are connected by a regular bus service with a bus le...

    Text Solution

    |

  2. A player throws a ball upwards with an initial speed of 29.4 ms^(-1)....

    Text Solution

    |

  3. Read each statement below carefully and state with reasons and example...

    Text Solution

    |

  4. A ball is dropped from a height of a height of 90 m on a floor. At eac...

    Text Solution

    |

  5. Explain clearly, with examples, the difference between : (a) magnitu...

    Text Solution

    |

  6. A man walks on a straight road from his home to a market 2.5 km away ...

    Text Solution

    |

  7. In above questions 13 and 14, we have carefully distinguished betwee...

    Text Solution

    |

  8. Look at the graphs (a) to (d) carefully and state, with reasons, with ...

    Text Solution

    |

  9. Fig. shows x-t plot of one dimensional motion a particle. Is it correc...

    Text Solution

    |

  10. A police van moving on a highway with a speed of 30 km h^(-1) Fires a ...

    Text Solution

    |

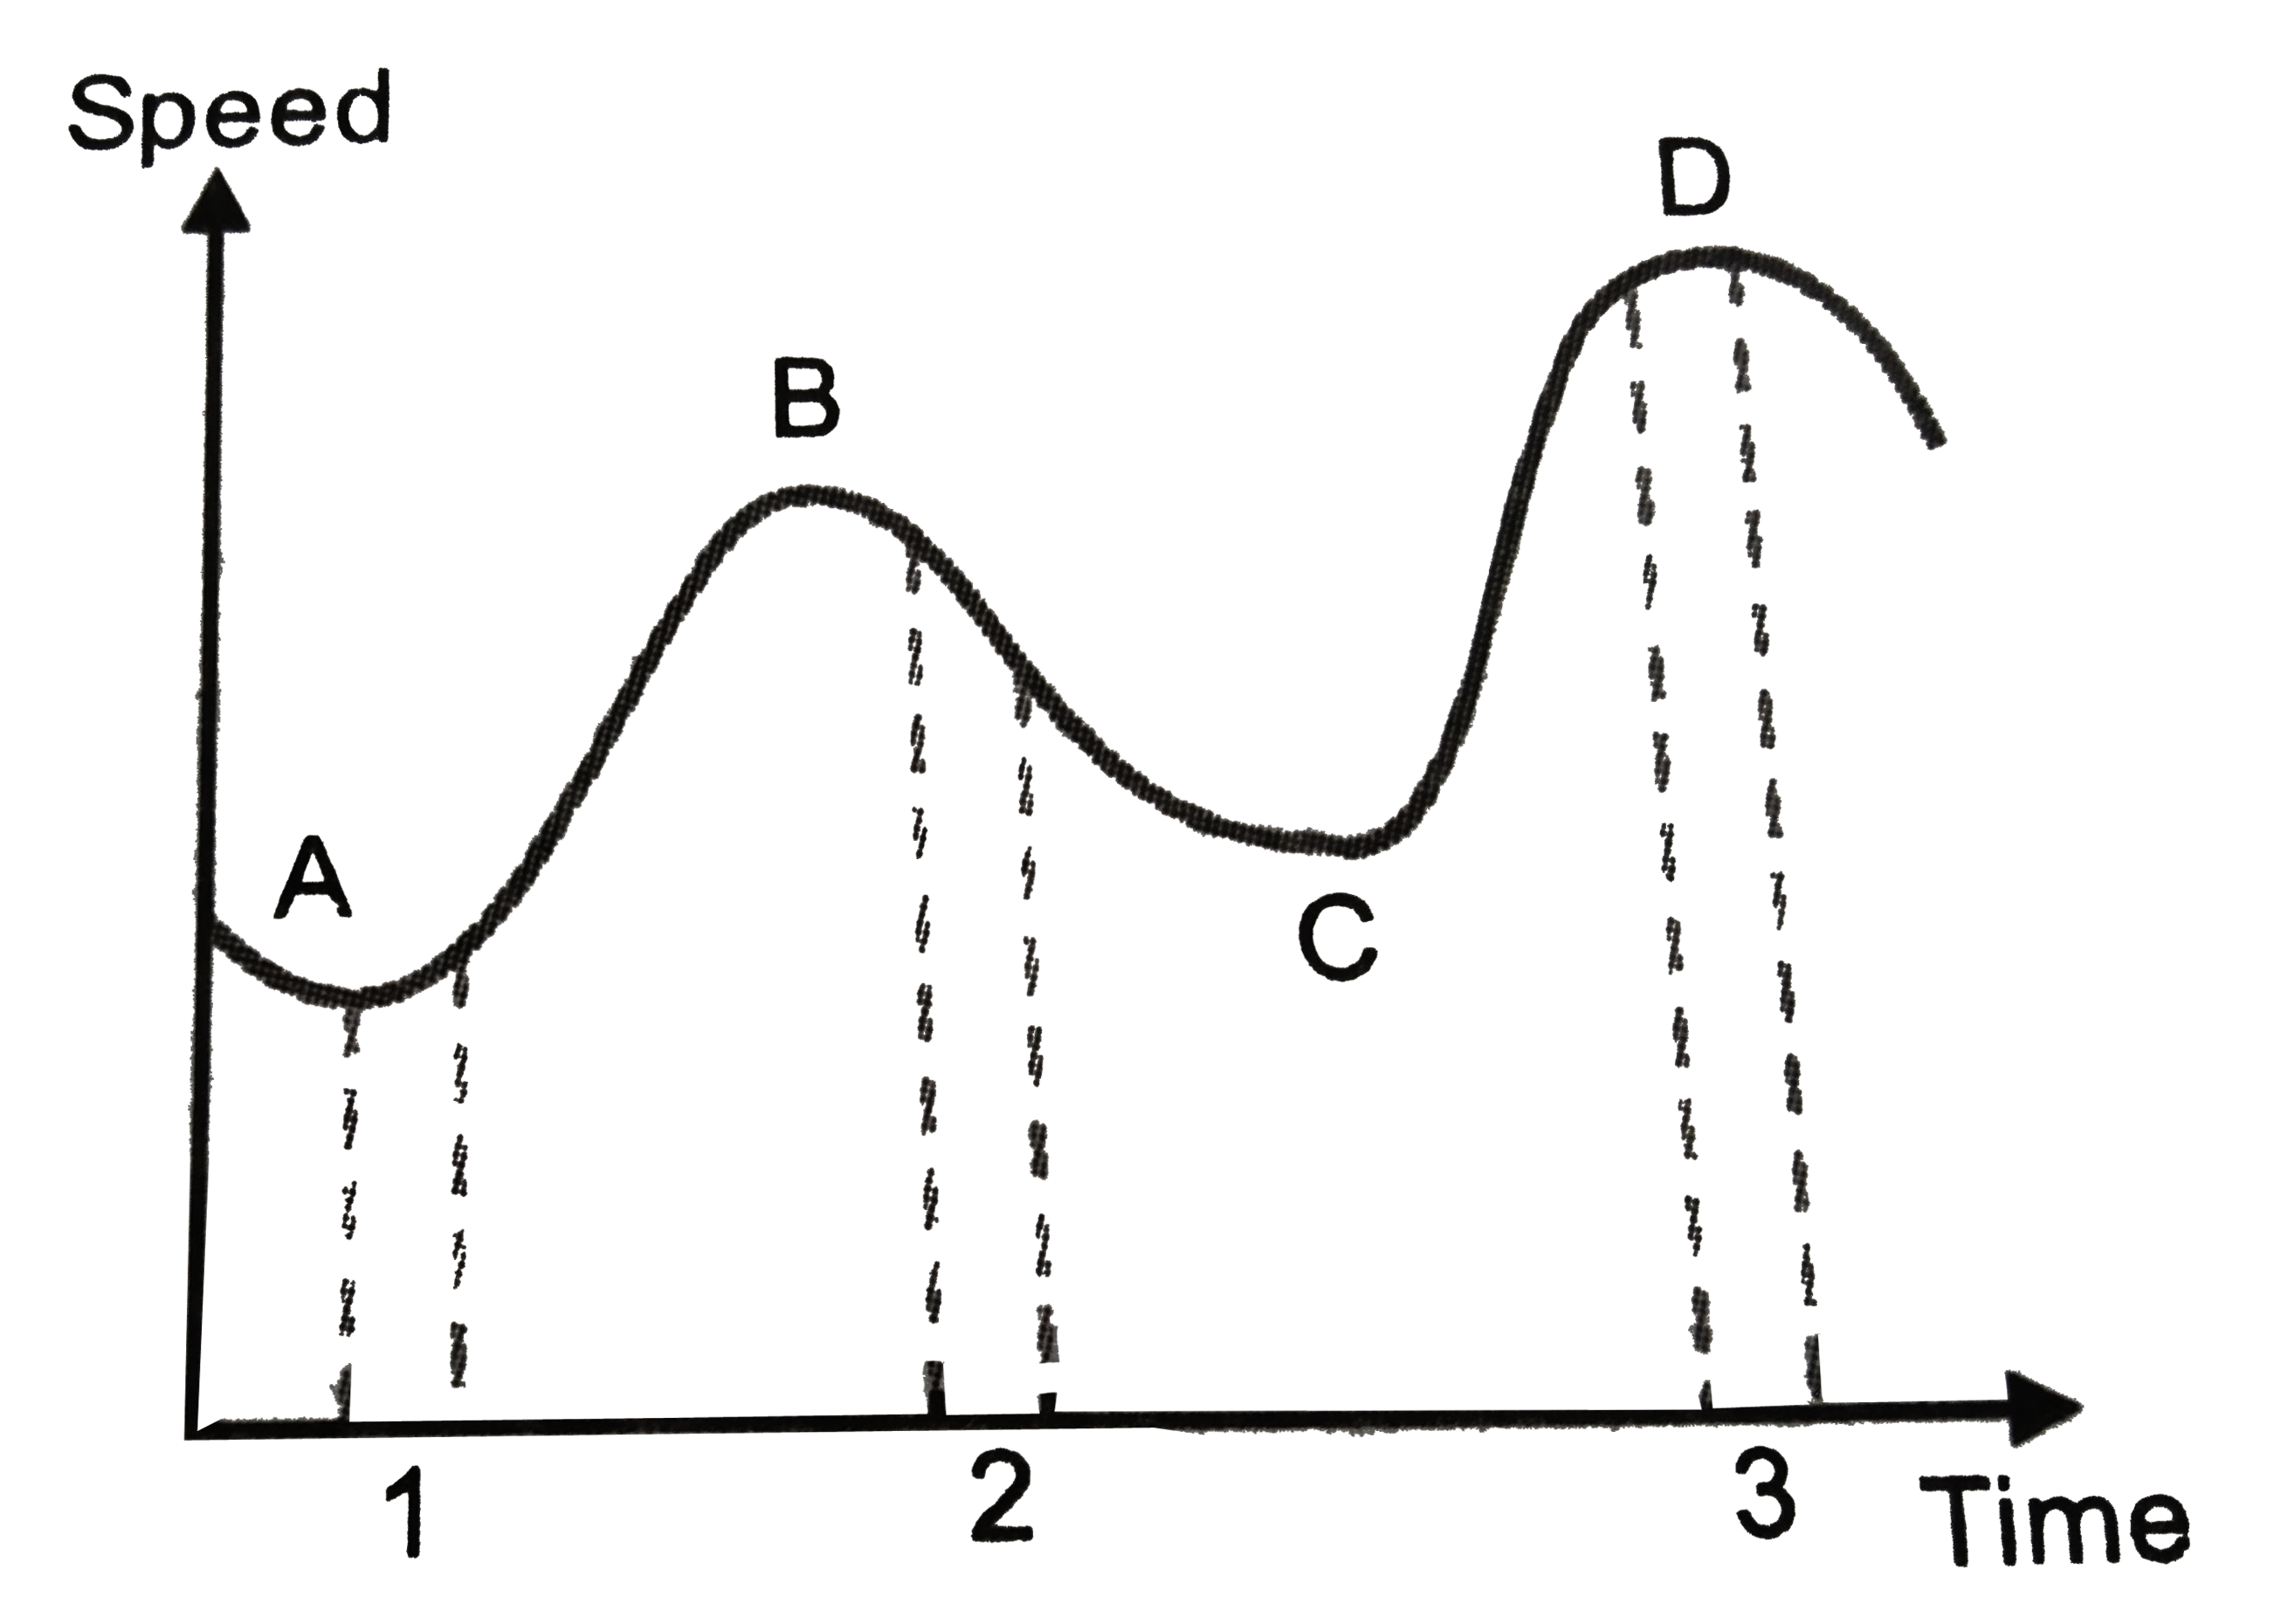
  11. Suggest a suitable physical situation for each of the following graph ...

    Text Solution

    |

  12. Fig gives the x-t plot of a particle executing one dimensional simple ...

    Text Solution

    |

  13. Fig. show the x-t plot of a particle in one dimensional motion. Three...

    Text Solution

    |

  14. Given a speed-time graph of a particle in motion along a constant dire...

    Text Solution

    |

  15. A three wheeler starts from rest, accelerates uniformly with 1 ms^(-2...

    Text Solution

    |

  16. A boy standing on a stationary lift (open from above) throws a ball up...

    Text Solution

    |

  17. On a long horizontally moving belt, a child runs to and fro with a sp...

    Text Solution

    |

  18. Two stones are thrown up simultaneously from the edge of a cliff 200 ...

    Text Solution

    |

  19. The speed-time graph of a particle moving along a fixed direction is s...

    Text Solution

    |

  20. The velocity-time graph of a particle in one-dimensional motion is sho...

    Text Solution

    |