A
B
C
D
Text Solution
Verified by Experts
The correct Answer is:


Topper's Solved these Questions
HEAT-2
MOTION|Exercise EXERCISE-3 (LEVEL-I)|22 VideosHEAT-2
MOTION|Exercise EXERCISE-3 (LEVEL-II)|15 VideosHEAT-2
MOTION|Exercise EXERCISE-2 (LEVEL-I)|24 VideosHEAT TRANSFER & THERMAL EXPANSION
MOTION|Exercise Exercise - 3 Section-B|19 VideosHYDROSTATIC, FLUID MECHANICS & VISCOSITY
MOTION|Exercise EXERCISE -3 (SECTION-B) PREVIOUS YEAR PROBLEM|7 Videos
Similar Questions
Explore conceptually related problems
MOTION-HEAT-2 -EXERCISE-2 (LEVEL-II)
- Case-I : The temperature of the walls of a vessel containing a gas at ...
Text Solution
|
- A vessel contains 6xx 10^(26) molecules m ^(-3). Mass of each molecule...
Text Solution
|
- A partition divides a container having insulated walls into two compar...
Text Solution
|
- During an experiment, an ideal gas is found to obey a condition (p^2)/...
Text Solution
|
- One gram molecule of nitrogen occupies 2 xx 10^(4) cm^(3) at a pressu...
Text Solution
|
- The mean kinetic energy of the molecules of a gas is 1/4 th of its val...
Text Solution
|
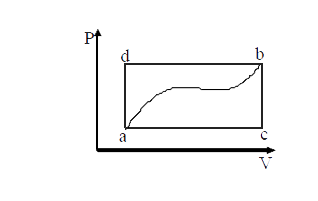
- In the adjoined figure the indicator diagram of an ideal thermodynamic...
Text Solution
|
- A mixture of ideal gases 7 kg of nitrogen and 11 kg ofCO(2), Then
Text Solution
|
- The temperature change versus heat supplied curve is given for 1 kg of...
Text Solution
|
- Three processes compose a thermodynamic cycle shown in the accompanyin...
Text Solution
|
- If DA and BC are adiabatic curves and AB and CD are isothermal curves ...
Text Solution
|
- A piston of mass m can move without friction in a uniform closed cylin...
Text Solution
|
- In the arrangement shown in Fig. gas is thermally insulated. An ideal ...
Text Solution
|